neco model questions vol1 2023 geography | Essay

Prepare for your exams with neco model questions vol1 questions? Reviewing past/model questions is one of the most effective ways to guarantee a high score. This practice hub features authentic 2023 geography (Essay) questions designed to simulate the real exam environment.

Practice these randomly selected questions to test your readiness.
Question 1 View Details
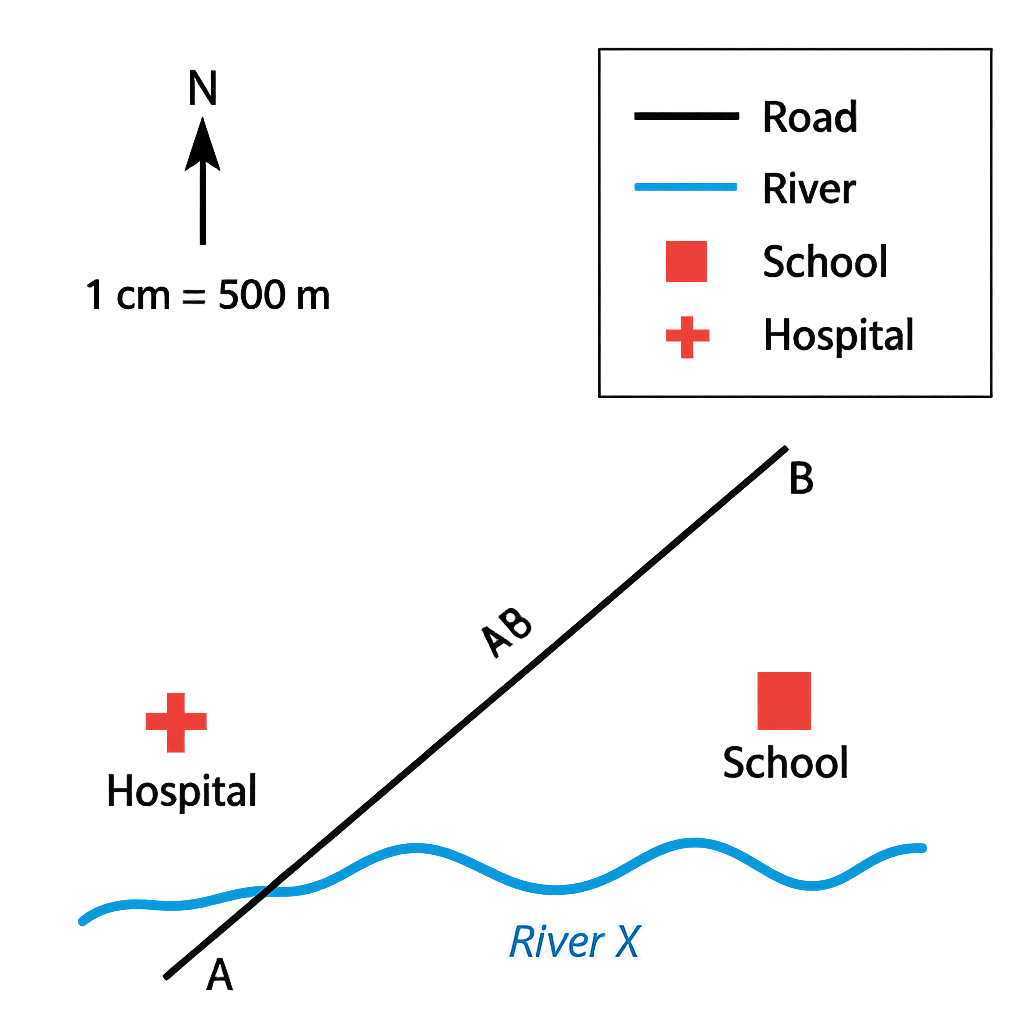
The map shown represents a small town and its immediate surroundings. The map scale is 1 cm : 500 m. The legend indicates that a solid black line represents a road, a blue line represents a river, a red square denotes a school and a red cross denotes a hospital. The north arrow points to the top of the map. Points A and B are marked on the road as shown.
Question Parts
(a)
State the bearing of the road from point A to point B.
(b)
Measure the distance between A and B on the map and calculate the actual ground distance.
(c)
Explain the meaning of each symbol in the legend and state one possible use of the school and hospital for the town’s residents.
Detailed Essay Solution & Marking Scheme Available

Get the step-by-step mathematical proofs, key points required by examiners, and a comprehensive breakdown from our AI Tutor.
Question 2 View Details
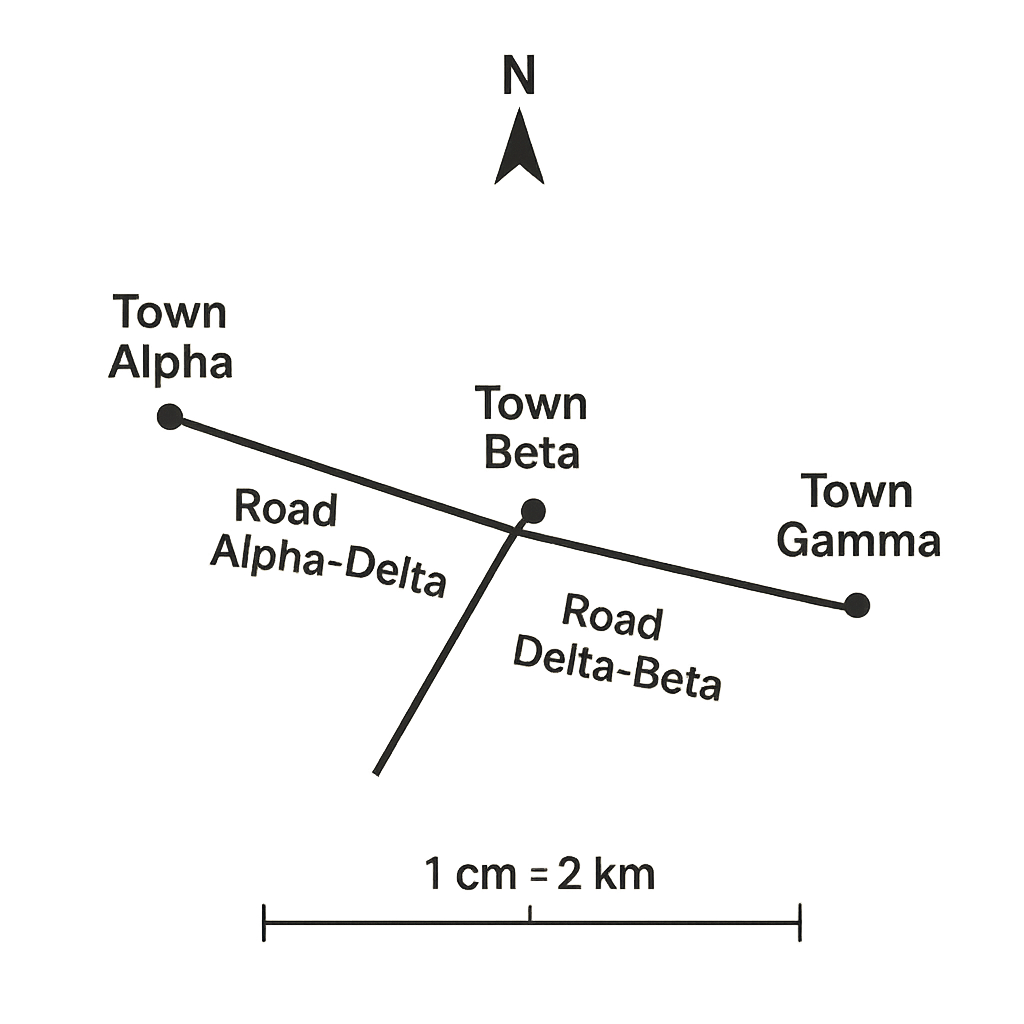
The map below shows three towns – Alpha, Beta and Gamma – connected by a road network. The map scale is 1 cm : 2 km. The road from Alpha to Beta consists of two straight sections: Alpha to Delta (3.5 cm) and Delta to Beta (2.0 cm). The road from Beta to Gamma is a single straight section of 4.2 cm. The map also indicates that a proposed new road would link Alpha directly to Gamma.
Question Parts
(a)
Calculate the actual ground distance (in kilometres) of the existing route from Alpha to Beta.
(b)
A vehicle travels from Alpha to Gamma via the existing roads (Alpha → Beta → Gamma) at an average speed of 60 km/h. Determine the total travel time in hours and minutes.
(c)
If the proposed direct road from Alpha to Gamma were built and measured 5.0 cm on the map, would it reduce the travel distance by at least 30 % compared with the existing route? Show your calculation and state your conclusion.
Detailed Essay Solution & Marking Scheme Available

Get the step-by-step mathematical proofs, key points required by examiners, and a comprehensive breakdown from our AI Tutor.

Question 3 View Details
A map of Nigeria shows the coordinates of three towns: - Town A: 7°30'N, 5°00'E - Town B: 8°15'N, 6°45'E - Town C: 6°45'N, 4°30'E Assume the Earth is a sphere with a mean radius of 6 371 km. For the purpose of this question use the approximations: - 1° of latitude ≈ 111 km - 1° of longitude at latitude φ ≈ 111 km × cos φ (use the average latitude of the two points involved). Answer the following:
Question Parts
(a)
Calculate the approximate north‑south distance between Town A and Town B.
(b)
Calculate the approximate east‑west distance between Town A and Town C. Use the average latitude of the two towns for the cosine correction.
(c)
Using the results above, determine the straight‑line distance between Town B and Town C by treating the north‑south and east‑west separations as the perpendicular sides of a right‑angled triangle. Comment briefly on the reliability of this method for real‑world distances.
Detailed Essay Solution & Marking Scheme Available

Get the step-by-step mathematical proofs, key points required by examiners, and a comprehensive breakdown from our AI Tutor.

Question 4 View Details
The table below shows the weather recorded for a coastal city in Nigeria over a 7‑day period. | Day | Max Temp (°C) | Min Temp (°C) | Rainfall (mm) | |-----|---------------|---------------|---------------| | 1 | 32 | 24 | 0 | | 2 | 34 | 25 | 5 | | 3 | 33 | 23 | 12 | | 4 | 31 | 22 | 0 | | 5 | 30 | 21 | 0 | | 6 | 29 | 20 | 20 | | 7 | 28 | 19 | 0 | Additional observations: on days when rainfall occurred, the wind blew from the southwest; on dry days, the wind blew from the northeast. Answer the following:
Question Parts
(a)
Calculate the average of the daily maximum temperatures and the average of the daily minimum temperatures for the week. State the overall mean temperature for the period.
(b)
Determine the temperature range (difference between the highest maximum temperature and the lowest minimum temperature) observed during the week.
(c)
Compute the total rainfall for the week and the average rainfall on the rainy days only.
Detailed Essay Solution & Marking Scheme Available

Get the step-by-step mathematical proofs, key points required by examiners, and a comprehensive breakdown from our AI Tutor.

Question 5 View Details
The table below shows the average monthly rainfall (mm) and mean monthly temperature (°C) recorded at a weather station in the Sudan savanna region over a year. | Month | Rainfall (mm) | Temperature (°C) | |-------|---------------|------------------| | Jan | 20 | 28 | | Feb | 30 | 30 | | Mar | 60 | 32 | | Apr | 120 | 34 | | May | 150 | 36 | | Jun | 180 | 38 | | Jul | 200 | 37 | | Aug | 190 | 35 | | Sep | 140 | 33 | | Oct | 80 | 31 | | Nov | 40 | 29 | | Dec | 25 | 27 | Using the data above, answer the following questions:
Question Parts
(a)
Identify the wet‑season months (those with rainfall ≥ 80 mm) and calculate the total rainfall that falls during the wet season.
(b)
Calculate the annual mean temperature for the station.
(c)
Explain how the climate characterised by the data influences the type of vegetation found in the Sudan savanna. Mention at least two adaptations of the dominant plant species.
(d)
If the average annual evapotranspiration for the area is estimated at 1500 mm, assess whether the region experiences a water surplus or deficit and discuss two possible implications for agriculture.
Detailed Essay Solution & Marking Scheme Available

Get the step-by-step mathematical proofs, key points required by examiners, and a comprehensive breakdown from our AI Tutor.

Question 6 View Details
A geologist studies a region where three rock units are exposed: a dark fine‑grained igneous rock, a coarse‑grained sedimentary rock with visible pebble conglomerates, and a foliated metamorphic rock. The following observations are recorded: - The igneous rock contains interlocking crystals of quartz and feldspar, and is cut by a set of vertical joints spaced about 0.5 m apart. - The sedimentary rock consists of rounded quartz pebbles (average diameter 2 cm) cemented by calcite; cross‑bedding is evident with a dip of 15° towards the east. - The metamorphic rock shows a well‑developed foliation that dips 30° to the southwest and contains garnet crystals of roughly 0.8 cm length. The geologist also notes that the region has experienced an uplift of 150 m over the last 2 million years. Answer the following questions:
Question Parts
(a)
Identify each rock unit (igneous, sedimentary, metamorphic) and give a brief explanation of the evidence that supports each identification.
(b)
For the sedimentary rock, calculate the minimum original thickness of the depositional layer if the present vertical exposure of the cross‑bedded beds is 12 m and the dip is 15°.
(c)
Estimate the average rate of uplift in millimetres per year and discuss two geomorphological consequences of such uplift in a tropical savanna environment.
(d)
Considering the presence of garnet in the metamorphic rock, infer the likely metamorphic grade and suggest a plausible protolith for this unit.
Detailed Essay Solution & Marking Scheme Available

Get the step-by-step mathematical proofs, key points required by examiners, and a comprehensive breakdown from our AI Tutor.

Question 7 View Details
A map of the southeastern part of Nigeria shows a plateau, a cuesta, an inselberg and a coastal plain. The plateau rises to about 900 m above sea level, the cuesta has a gentle dip‑slope facing the sea and a steep scarp slope inland, the inselberg stands isolated on the plateau, and the coastal plain is a narrow strip of low‑lying land backed by the sea.
Question Parts
(a)
Identify the two geomorphological processes that are primarily responsible for the formation of the plateau and the cuesta. Explain briefly how each process operates.
(b)
Discuss how the presence of the inselberg influences the local micro‑climate and vegetation on the surrounding plateau.
(c)
Evaluate the suitability of the coastal plain for intensive agriculture, considering soil type, drainage and exposure to sea erosion.
(d)
Propose two land‑use management measures to reduce soil erosion on the plateau and justify how each measure works.
Detailed Essay Solution & Marking Scheme Available

Get the step-by-step mathematical proofs, key points required by examiners, and a comprehensive breakdown from our AI Tutor.

Question 8 View Details
A drainage basin in the northern Guinea savanna covers an area of 150 km². The underlying soil is sandy loam with a runoff coefficient of 0.25. The average annual rainfall is 1 200 mm, but a storm event of 30 mm in 2 hours is expected during the rainy season. The main channel is 12 km long and has an average slope of 0.02.
Question Parts
(a)
Using the rational method, calculate the peak discharge (in m³ s⁻¹) for the storm event. Show all steps and state any assumptions you make.
(b)
Classify the stream order of the main channel using the Strahler method, assuming the basin contains 8 first‑order streams that join to form second‑order streams, and so on. Explain your reasoning.
(c)
Discuss two potential adverse effects of the high peak discharge on downstream settlements and agriculture.
(d)
Recommend two sustainable drainage practices suitable for this basin and explain how each practice would reduce the peak discharge.
Detailed Essay Solution & Marking Scheme Available

Get the step-by-step mathematical proofs, key points required by examiners, and a comprehensive breakdown from our AI Tutor.

Master the Exam!

You've seen a preview, but there are thousands more questions plus AI tutor to break down complex solutions.

Unlock Full Access Available for Android & Windows
Help others prepare! Share this practice hub:
Chat with Support