neco model questions vol1 2017 geography | Essay

Prepare for your exams with neco model questions vol1 questions? Reviewing past/model questions is one of the most effective ways to guarantee a high score. This practice hub features authentic 2017 geography (Essay) questions designed to simulate the real exam environment.

Practice these randomly selected questions to test your readiness.
Question 1 View Details
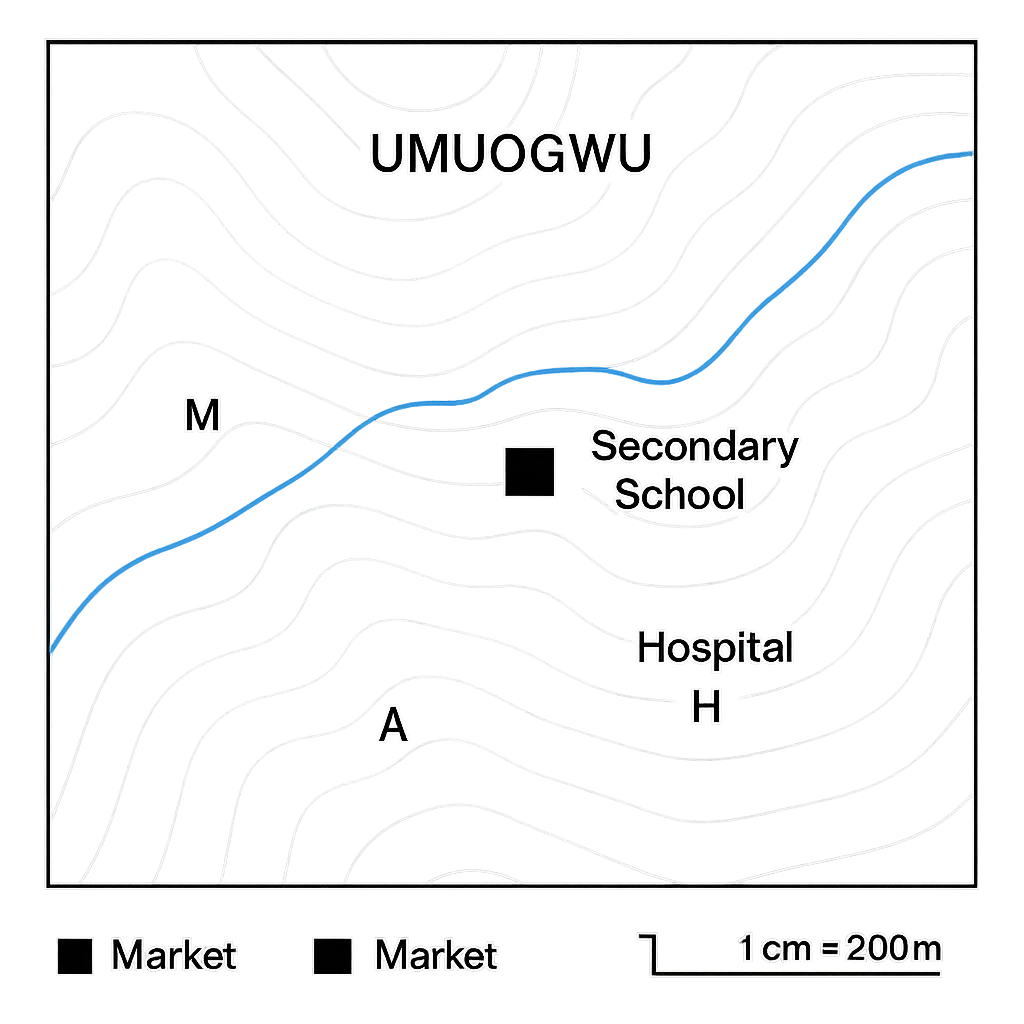
The schematic map of the town of Umuogwu is shown. The map scale is 1 cm = 200 m and contour lines represent a 20 m elevation change.
Question Parts
(a)
Identify the symbol used for the secondary school on the map.
(b)
Using the scale, calculate the actual distance between the market and the river which are 3.5 cm apart on the map. Give your answer in metres.
(c)
Determine the bearing of the road from the secondary school to the hospital, given that the road on the map makes an angle of 45° measured clockwise from north.
(d)
Point A is at an elevation of 100 m. Point B lies three contour lines higher. If the horizontal distance on the map between A and B is 2.0 cm, estimate the gradient (percentage slope) between the two points.
Detailed Essay Solution & Marking Scheme Available

Get the step-by-step mathematical proofs, key points required by examiners, and a comprehensive breakdown from our AI Tutor.
Question 2 View Details
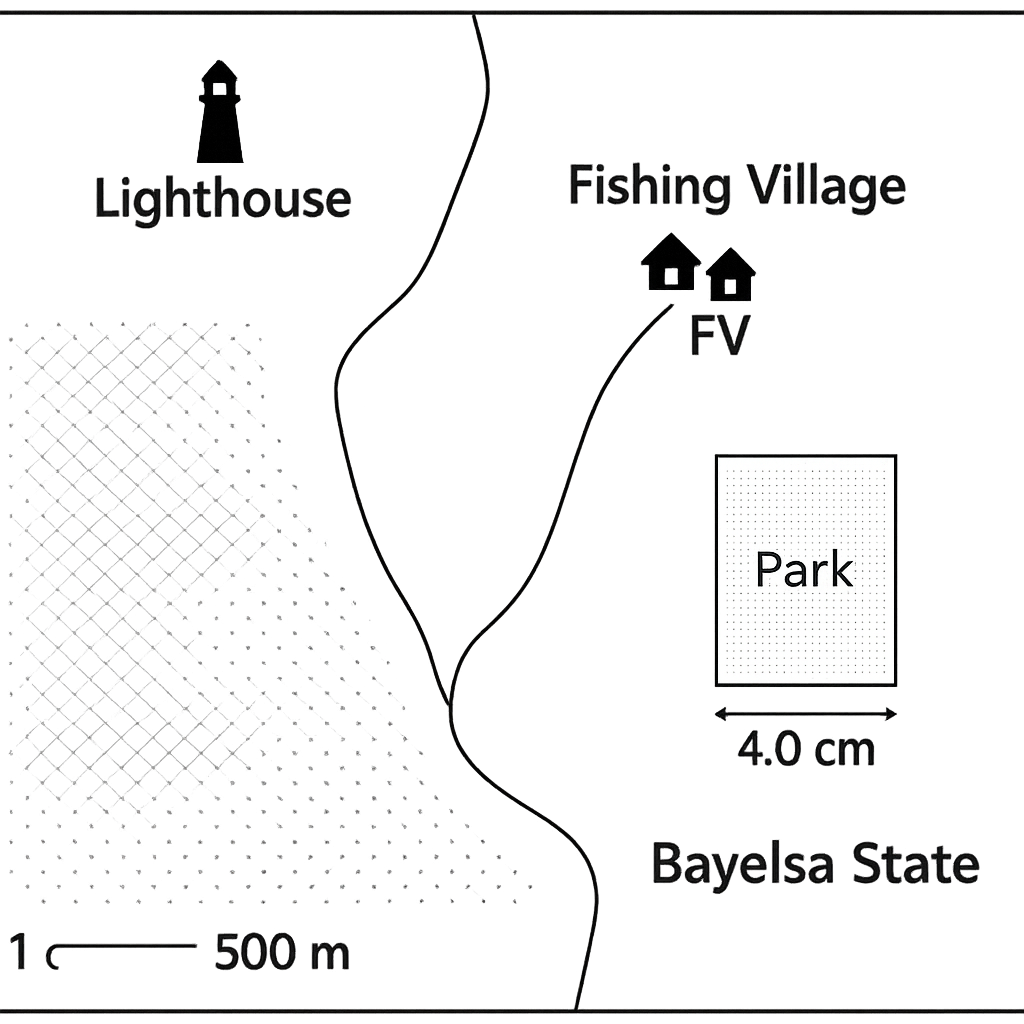
A tourist map of the coastal region of Bayelsa State is shown. The map scale is 1 cm = 500 m.
Question Parts
(a)
The distance between the lighthouse and the fishing village is 6.2 cm on the map. Find the actual distance in kilometres.
(b)
If a new map of the same area is to be drawn at a scale of 1 cm = 250 m, what will be the length in centimetres of the lighthouse‑fishing‑village distance on the new map?
(c)
The map shows a rectangular park whose length measures 4.0 cm and width 2.5 cm. Calculate the real area of the park in hectares on the original map scale.
(d)
A proposed road will cut across the park diagonally. Using the original scale, determine the actual length of the road in metres. (Use Pythagoras).
Detailed Essay Solution & Marking Scheme Available

Get the step-by-step mathematical proofs, key points required by examiners, and a comprehensive breakdown from our AI Tutor.

Question 3 View Details
A location is given the geographic coordinates 6°30' N latitude and 3°20' E longitude. (a) Explain how the latitude and longitude system enables the precise positioning of any place on the Earth’s surface. (b) Using the given coordinates, determine: i. The approximate distance of the place from the Equator. ii. The approximate distance of the place from the Prime Meridian. iii. The climatic zone in which the place is likely to fall. iv. The standard time zone applicable to the location. (c) Discuss two ways in which the position of this place (its latitude, longitude and associated climatic zone) could influence human activities such as agriculture and settlement patterns.
Detailed Essay Solution & Marking Scheme Available

Get the step-by-step mathematical proofs, key points required by examiners, and a comprehensive breakdown from our AI Tutor.

Question 4 View Details
A weather station records the following monthly data for a coastal region: - Mean daily maximum temperature: 32°C - Mean daily minimum temperature: 22°C - Total rainfall for the month: 120 mm On a particular day during the same month, the following synoptic changes were observed: - Atmospheric pressure fell from 1015 hPa to 1005 hPa over a period of six hours. - Wind direction shifted from a northeasterly (NE) to a southerly (S) wind. - Temperature dropped by 4°C. (a) Identify the Köppen climate classification that best fits the monthly data and justify your choice. (b) Calculate the average diurnal temperature range for the month and discuss its possible effects on agricultural practices in the region. (c) Explain the meteorological processes that could cause the observed pressure fall, wind shift and temperature drop, and predict the type of weather that is likely to follow the cold front.
Detailed Essay Solution & Marking Scheme Available

Get the step-by-step mathematical proofs, key points required by examiners, and a comprehensive breakdown from our AI Tutor.

Question 5 View Details
The table below shows the average maximum temperature (°C) and average monthly rainfall (mm) recorded at the city of Zaria over a typical year. | Month | Avg. Max Temp (°C) | Avg. Rainfall (mm) | |-------|--------------------|--------------------| | Jan | 28 | 120 | | Feb | 30 | 80 | | Mar | 32 | 60 | | Apr | 33 | 30 | | May | 31 | 20 | | Jun | 28 | 10 | | Jul | 26 | 5 | | Aug | 26 | 5 | | Sep | 27 | 15 | | Oct | 28 | 40 | | Nov | 29 | 80 | | Dec | 28 | 110 | Using the data and your knowledge of the Nigerian climate, answer the following questions: a) Identify the Köppen climate classification for Zaria and justify your choice. b) Calculate the average annual rainfall for the city. c) Explain how the city’s altitude (approximately 200 m above sea level) influences its temperature compared with a coastal city at sea level. d) Discuss two possible impacts of climate change on agricultural production in Zaria, linking them to the climate data provided.
Question Parts
(a)
Identify the Köppen climate classification for Zaria and justify your choice.
(b)
Calculate the average annual rainfall for the city.
(c)
Explain how the city’s altitude (approximately 200 m above sea level) influences its temperature compared with a coastal city at sea level.
(d)
Discuss two possible impacts of climate change on agricultural production in Zaria, linking them to the climate data provided.
Detailed Essay Solution & Marking Scheme Available

Get the step-by-step mathematical proofs, key points required by examiners, and a comprehensive breakdown from our AI Tutor.

Question 6 View Details
Three rock samples have been collected from different locations in the Jos Plateau region. Their main characteristics are described below. Sample A: Coarse‑grained pink rock, visible crystals of quartz, feldspar and mica; texture is phaneritic. Sample B: Fine‑grained gray rock, composed mainly of sand‑sized quartz grains cemented by silica; ripple marks are present on its surface. Sample C: Foliated metamorphic rock with alternating bands of mica and quartz; texture is schistose. Answer the following: a) Classify each sample as igneous, sedimentary or metamorphic and give a brief justification. b) The geological history of the area involved three major events: (i) deposition of sediments that later formed Sample B, (ii) burial and metamorphism that produced Sample C, and (iii) intrusion of a granitic magma that solidified as Sample A. Describe the sequence of these events and explain the processes that link the three rocks. c) Identify two economic uses of each rock type in Nigeria and briefly explain why the rock’s properties make it suitable for those uses.
Question Parts
(a)
Classify each sample as igneous, sedimentary or metamorphic and give a brief justification.
(b)
The geological history of the area involved three major events: (i) deposition of sediments that later formed Sample B, (ii) burial and metamorphism that produced Sample C, and (iii) intrusion of a granitic magma that solidified as Sample A. Describe the sequence of these events and explain the processes that link the three rocks.
(c)
Identify two economic uses of each rock type in Nigeria and briefly explain why the rock’s properties make it suitable for those uses.
Detailed Essay Solution & Marking Scheme Available

Get the step-by-step mathematical proofs, key points required by examiners, and a comprehensive breakdown from our AI Tutor.

Question 7 View Details
A topographic map of Nigeria shows three major physiographic units: 1. The Jos Plateau – average elevation 800 m, area 50 000 km², mean annual rainfall 1 200 mm. 2. The Niger Delta coastal plain – width 200 km along the coast, elevation 0‑50 m, mean annual rainfall 1 800 mm. 3. The Niger River floodplain – area 30 000 km², during the flood season the water depth averages 2 m over the whole plain. Using the data above, answer the following questions:
Question Parts
(a)
Calculate the total volume of water (in cubic metres) stored on the floodplain during the peak of the flood season.
(b)
Discuss how the differences in elevation and rainfall among the three landforms influence the dominant soil‑forming processes in each unit.
(c)
Evaluate which of the three landforms is most suitable for large‑scale agriculture, considering climate, soil characteristics and topography. Justify your answer with at least two supporting arguments.
Detailed Essay Solution & Marking Scheme Available

Get the step-by-step mathematical proofs, key points required by examiners, and a comprehensive breakdown from our AI Tutor.

Question 8 View Details
The Upper Benue River basin covers an area of 1 200 km². The basin receives a mean annual rainfall of 1 500 mm. Of the total rainfall, 30 % infiltrates into the soil, 40 % is lost to evapotranspiration and the remaining water contributes to surface runoff. A dam situated near the basin outlet stores 0.5 km³ of water for hydro‑electric generation. Using the information above, answer the following:
Question Parts
(a)
Calculate the total annual volume of surface runoff (in cubic metres) generated from the basin, ignoring the water stored in the dam.
(b)
Determine the average annual discharge (in cubic metres per second) from the basin based on the runoff volume obtained in part (a).
(c)
Deforestation in the upper part of the basin reduces infiltration to 25 % of rainfall (a 5 % absolute drop) while other percentages remain unchanged. Re‑calculate the new average discharge and discuss briefly how this change would affect flood risk in downstream communities.
Detailed Essay Solution & Marking Scheme Available

Get the step-by-step mathematical proofs, key points required by examiners, and a comprehensive breakdown from our AI Tutor.

Master the Exam!

You've seen a preview, but there are thousands more questions plus AI tutor to break down complex solutions.

Unlock Full Access Available for Android & Windows
Help others prepare! Share this practice hub:
Chat with Support