Neco 2020 Mathematics Question 11
Practice essay / theory question 11 from the 2020 Neco Mathematics examination. This question covers Graphs, Interpretation of graphs, Area under a curve .
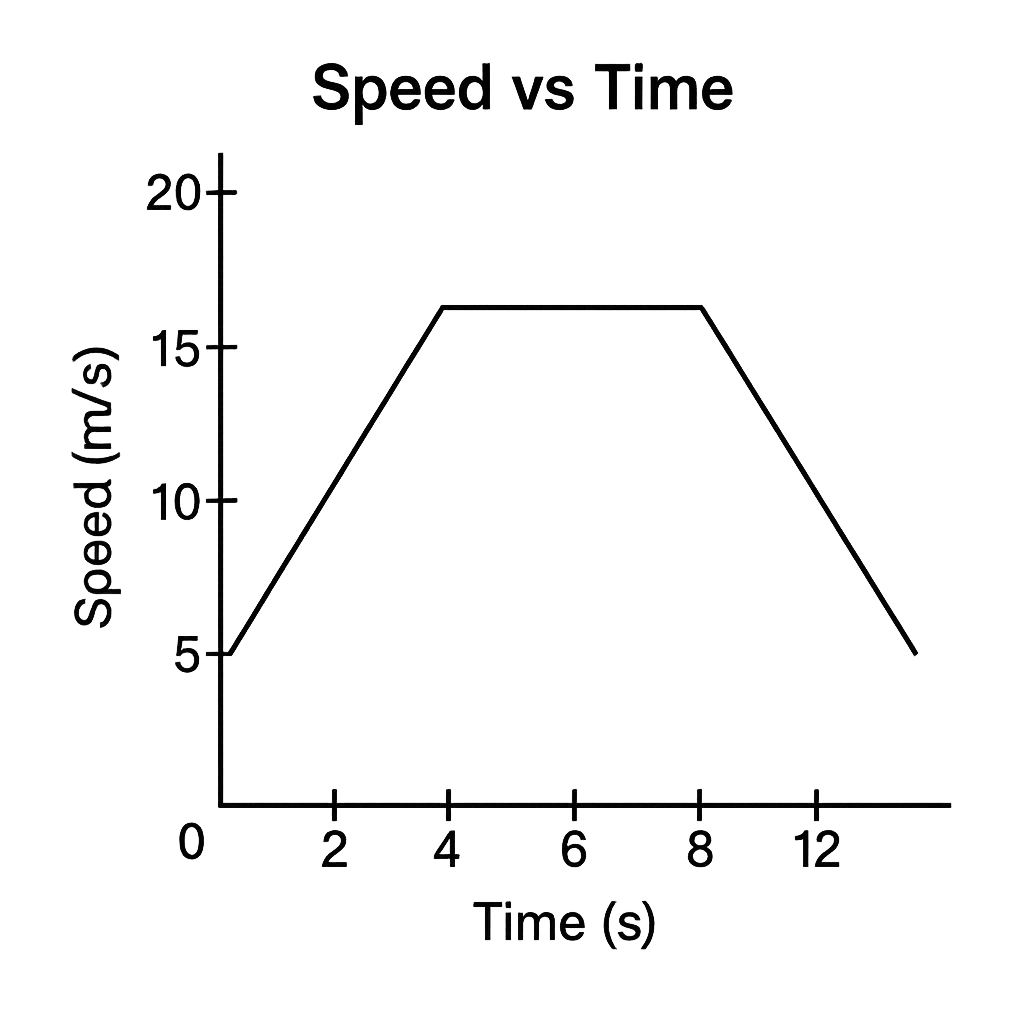
The graph below shows the variation of the speed (v) of a car in metres per second with respect to time (t) in seconds during a 12‑second interval.
Question Parts
Detailed Solution & Marking Scheme
Get the step-by-step solution, key points required by examiners and detailed marking guidance through the Edcrib AI Tutor.
Reveal AnswerAbout This Question
This is Neco 2020 Mathematics Question 11. It is one of the essay questions from the 2020 Neco Mathematics examination.
The question covers Graphs, Interpretation of graphs, Area under a curve .
Master the Exam!
You've seen a preview, but there are thousands more questions plus AI tutor to break down complex solutions.