gce model questions vol1 2023 geography | Essay

Prepare for your exams with gce model questions vol1 questions? Reviewing past/model questions is one of the most effective ways to guarantee a high score. This practice hub features authentic 2023 geography (Essay) questions designed to simulate the real exam environment.

Practice these randomly selected questions to test your readiness.
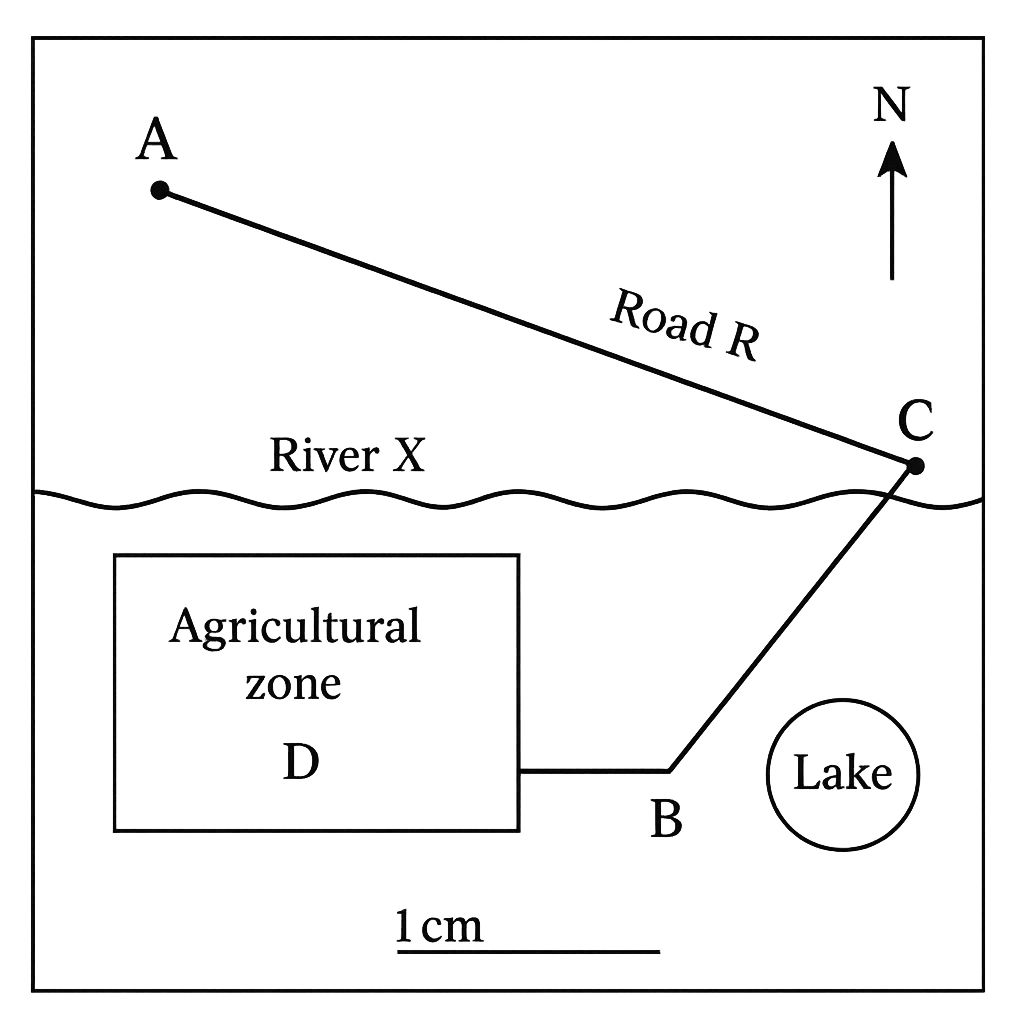
Question 1 View Details
The map of the fictional district of Umuahia is shown. The map scale is 1 cm : 5 km and the compass rose indicates north at the top. The map includes the following labelled features: - Town A - Town B - Town C - River X (shown flowing roughly east‑west between the towns) - Road R which links Town A to Town C to Town B. The straight‑line distance between Town A and Town B measures 7 cm on the map. On the map the distance from Town A to Town C is 3 cm and from Town C to Town B is 4 cm. The line AB makes an angle of 30° east of north. Answer the following questions.
Question Parts
(a)
Calculate the real straight‑line distance between Town A and Town B in kilometres.
(b)
Determine the total length of Road R in kilometres.
(c)
State the three‑figure bearing of the line from Town A to Town B.
Detailed Essay Solution & Marking Scheme Available

Get the step-by-step mathematical proofs, key points required by examiners, and a comprehensive breakdown from our AI Tutor.
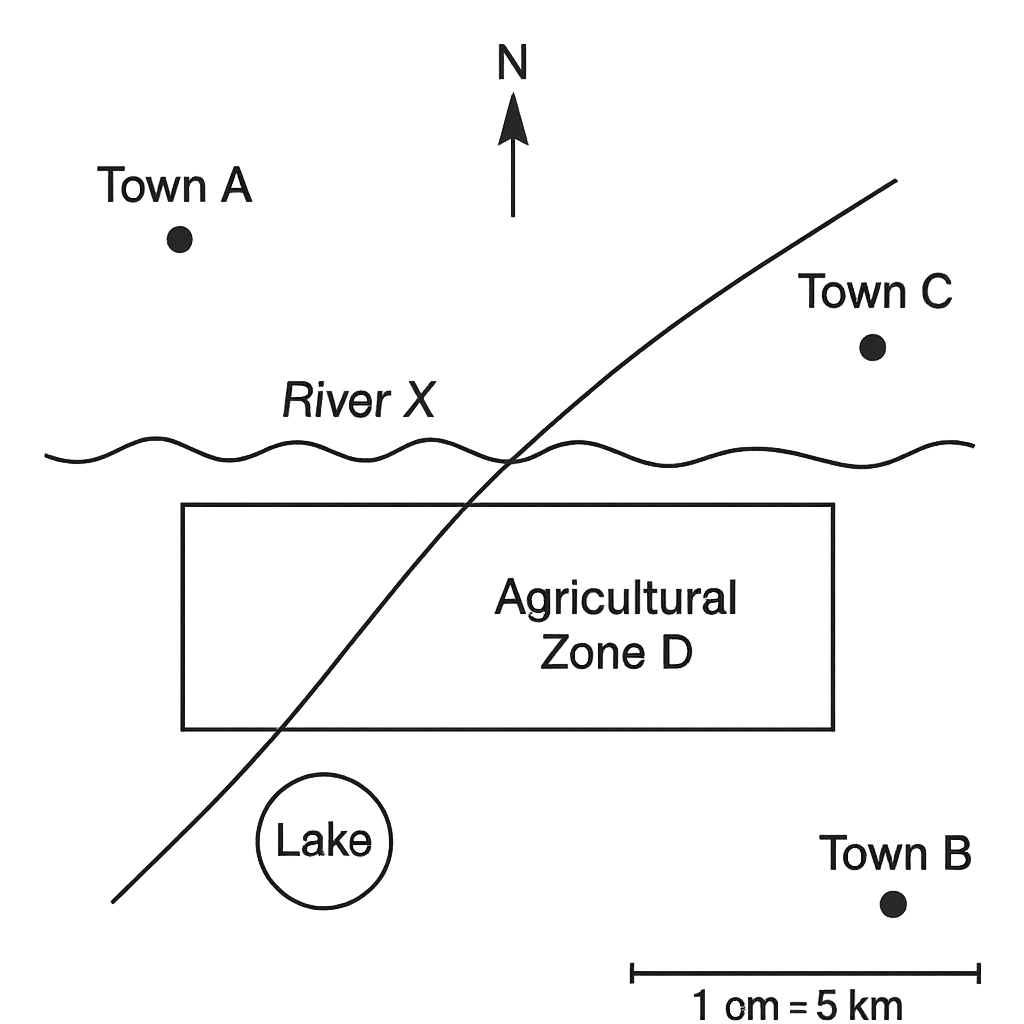
Question 2 View Details
Using the same map of the district of Umuahia (scale 1 cm : 5 km) answer the following:
Question Parts
(a)
The agricultural zone D on the map is a rectangle measuring 6 cm in length and 4 cm in width. Calculate its actual area in square kilometres.
(b)
If the agricultural zone D has a total population of 12 500 people, determine the population density (people per km²) to one decimal place.
(c)
The lake shown on the map is approximately circular and its circumference measures 2.5 cm on the map. Estimate: (i) the real radius of the lake in kilometres (use π = 3.14), (ii) the lake’s surface area in square kilometres (round to two decimal places).
Detailed Essay Solution & Marking Scheme Available

Get the step-by-step mathematical proofs, key points required by examiners, and a comprehensive breakdown from our AI Tutor.
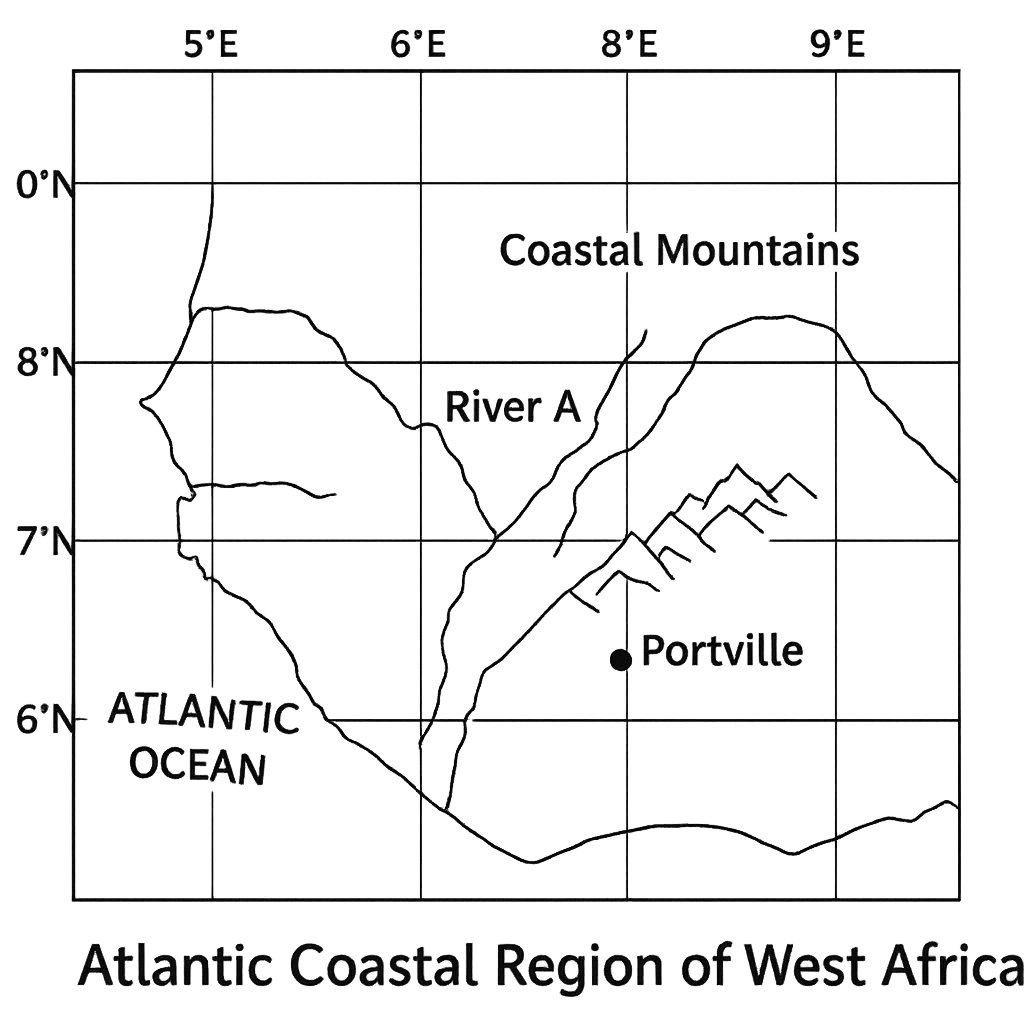
Question 3 View Details
The map shown represents a portion of the Atlantic coastal region of West Africa. Latitude lines are drawn at 5°N, 6°N, 7°N, 8°N, 9°N and 10°N and longitude lines at 5°E, 6°E, 7°E, 8°E, 9°E and 10°E. The major settlement Portville is marked at the intersection of the 7°30'N latitude line and the 8°15'E longitude line. River A flows from the point (6°N, 7°E) to (9°N, 9°E). The coastal mountain range lies roughly between 8°N and 9°N and extends from 8°E to 10°E. The map is drawn using a Mercator projection. Answer the following questions:
Question Parts
(a)
State the latitude and longitude of Portville to the nearest minute.
(b)
Estimate the straight‑line distance (in kilometres) between the source of River A (6°N, 7°E) and its mouth (9°N, 9°E). Use 1° of latitude = 111 km and assume the mean latitude for the longitude conversion is 7.5°N (cos 7.5° ≈ 0.991). Show the steps you use.
(c)
Explain how the latitude of Portville influences its general climate characteristics.
(d)
Discuss two ways in which the Mercator projection used for the map may distort the representation of distance or area for the features shown.
Detailed Essay Solution & Marking Scheme Available

Get the step-by-step mathematical proofs, key points required by examiners, and a comprehensive breakdown from our AI Tutor.

Question 4 View Details
The table below gives observed weather data for the coastal town of Lagos over a 24‑hour period. | Time (UTC) | Temperature (°C) | Relative Humidity (%) | Wind Direction | Wind Speed (km/h) | |------------|------------------|-----------------------|----------------|-------------------| | 00:00 | 24 | 88 | NNE | 12 | | 06:00 | 26 | 84 | NE | 10 | | 12:00 | 30 | 70 | E | 8 | | 18:00 | 28 | 78 | SE | 14 | | 24:00 | 25 | 85 | S | 16 | Answer the following questions:
Question Parts
(a)
Define "weather" and "climate" and explain one key difference between the two concepts.
(b)
Describe the formation of a sea‑breeze in Lagos, referring to the temperature and pressure differences between land and sea during the day.
(c)
Using the data in the table, identify the time of day when the sea‑breeze is most likely to be strongest and justify your answer with reference to wind direction and speed.
(d)
Explain how the observed diurnal variation in temperature and humidity reflects the influence of the nearby Atlantic Ocean on Lagos’s weather.
Detailed Essay Solution & Marking Scheme Available

Get the step-by-step mathematical proofs, key points required by examiners, and a comprehensive breakdown from our AI Tutor.

Question 5 View Details
The table below gives the average monthly temperature (°C) and total monthly rainfall (mm) for three Nigerian cities. | City | Jan | Feb | Mar | Apr | May | Jun | Jul | Aug | Sep | Oct | Nov | Dec | |--------|-----|-----|-----|-----|-----|-----|-----|-----|-----|-----|-----|-----| | Lagos | 27 | 28 | 29 | 30 | 31 | 30 | 29 | 28 | 28 | 28 | 27 | 27 | | | 120 | 110 | 130 | 150 | 200 | 250 | 300 | 310 | 260 | 180 | 130 | 110 | | Kano | 32 | 33 | 34 | 35 | 36 | 35 | 34 | 33 | 32 | 31 | 30 | 30 | | | 5 | 7 | 12 | 30 | 70 | 120 | 150 | 140 | 80 | 30 | 10 | 5 | | Jos | 22 | 23 | 24 | 25 | 26 | 24 | 22 | 21 | 20 | 19 | 18 | 18 | | | 30 | 40 | 60 | 80 | 120 | 150 | 140 | 130 | 110 | 70 | 40 | 30 | Using this information, answer the following questions:
Question Parts
(a)
Classify the climate of each city according to the Köppen system and explain the criteria you used.
(b)
Discuss two ways in which the climate of Kano is likely to affect agricultural practices compared with Lagos.
(c)
Considering current trends of rising temperatures, evaluate the potential impact on water resources in Jos over the next 20 years, and suggest two adaptation measures that could mitigate these impacts.
Detailed Essay Solution & Marking Scheme Available

Get the step-by-step mathematical proofs, key points required by examiners, and a comprehensive breakdown from our AI Tutor.

Question 6 View Details
A field geologist collects three rock samples from different parts of Nigeria. - Sample X: Dark, fine‑grained rock with visible plagioclase phenocrysts. - Sample Y: Light‑coloured, coarse‑grained rock with interlocking crystals of quartz and feldspar. - Sample Z: Reddish, porous rock containing fossil shells. Using these observations, answer the following:
Question Parts
(a)
Identify the rock type of each sample (igneous, sedimentary or metamorphic) and justify your identification using the key characteristics described.
(b)
Explain the formation processes of the rocks you identified in part (a), linking each to the stages of the rock cycle.
Detailed Essay Solution & Marking Scheme Available

Get the step-by-step mathematical proofs, key points required by examiners, and a comprehensive breakdown from our AI Tutor.

Question 7 View Details
Nigeria exhibits a diverse range of landforms that result from a combination of tectonic movements, weathering and erosional processes.
Question Parts
(a)
Describe the processes that lead to the formation of each of the following landforms in Nigeria:
(b)
Analyse how each of these landforms influences patterns of human settlement and economic activity.
(c)
Given the data below, evaluate the suitability of each area for arable agriculture. Use at least two criteria in your evaluation. Plateau – rainfall 1200 mm yr⁻¹, soil depth 1.5 m, slope 5°. Cuesta – rainfall 1500 mm yr⁻¹, soil depth 2.0 m, slope 12°. Inselberg – rainfall 800 mm yr⁻¹, soil depth 0.5 m, slope 30°.
Detailed Essay Solution & Marking Scheme Available

Get the step-by-step mathematical proofs, key points required by examiners, and a comprehensive breakdown from our AI Tutor.

Question 8 View Details
The Benue River basin in central Nigeria has the following characteristics: total river length 300 km, source elevation 600 m above sea level, mouth elevation 0 m, average discharge 150 m³ s⁻¹, average channel width 80 m and average depth 3 m.
Question Parts
(a)
Explain how the longitudinal gradient of the river influences its velocity, erosion and sediment transport.
(b)
Using the data provided, calculate: (i) the average longitudinal gradient expressed as metres per kilometre and as a percentage; (ii) the average flow velocity assuming a rectangular cross‑section; (iii) the approximate time taken for a water parcel to travel from the source to the mouth.
(c)
Discuss two major flood‑risk implications of the drainage characteristics of the Benue basin and recommend one structural and one non‑structural management measure for each implication.
Detailed Essay Solution & Marking Scheme Available

Get the step-by-step mathematical proofs, key points required by examiners, and a comprehensive breakdown from our AI Tutor.

Question 9 View Details
A farmer in the northern Guinea savanna region of Nigeria observes varying soil characteristics across his 12‑hectare farm, which lies on a gently undulating landscape. The upper 30 cm of the soil on the higher ground is a dark brown loam with a pH of 6.8, while the lower lying area has a lighter brown sandy loam with a pH of 5.2 and a visible accumulation of iron‑oxide nodules. The farmer also notes a thin, dark organic layer (O horizon) over the surface in the shaded part of the farm.
Question Parts
(a)
Explain the five factors of soil formation (CLORPT) and discuss how each factor is likely influencing the observed differences between the higher and lower parts of the farm.
(b)
Using the information provided, classify the soils of the higher and lower areas according to the FAO soil classification system, justifying your choice.
(c)
Propose two management practices for each soil type that would improve its productivity for cereal cultivation, and explain the scientific basis for each practice.
(d)
The farmer plans to introduce a three‑year crop rotation that includes a leguminous plant. Discuss how this rotation could affect soil fertility and structure in both soil types over the rotation period.
Detailed Essay Solution & Marking Scheme Available

Get the step-by-step mathematical proofs, key points required by examiners, and a comprehensive breakdown from our AI Tutor.

Question 10 View Details
A protected area in the lower Niger basin consists of a mosaic of forest, savanna and wetland habitats. Recent satellite imagery shows that the proportion of savanna has increased at the expense of forest over the past decade. Field observations record the following dominant species: Forest: Triplochiton scleroxylon, Alstonia congensis, Pterocarpus erinaceus Savanna: Hyparrhenia rufa, Combretum glutinosum, Acacia nilotica Wetland: Papyrus (Cyperus papyrus), Typha angustifolia, Nymphaea lotus
Question Parts
(a)
Explain the key ecological factors that determine the distribution of forest, savanna and wetland vegetation in this region.
(b)
Using the species list, identify one indicator species for each habitat and justify why it serves as an indicator.
Detailed Essay Solution & Marking Scheme Available

Get the step-by-step mathematical proofs, key points required by examiners, and a comprehensive breakdown from our AI Tutor.

Master the Exam!

You've seen a preview, but there are thousands more questions plus AI tutor to break down complex solutions.

Unlock Full Access Available for Android & Windows
Help others prepare! Share this practice hub:
Chat with Support