gce model questions vol1 2018 geography | Essay

Prepare for your exams with gce model questions vol1 questions? Reviewing past/model questions is one of the most effective ways to guarantee a high score. This practice hub features authentic 2018 geography (Essay) questions designed to simulate the real exam environment.

Practice these randomly selected questions to test your readiness.
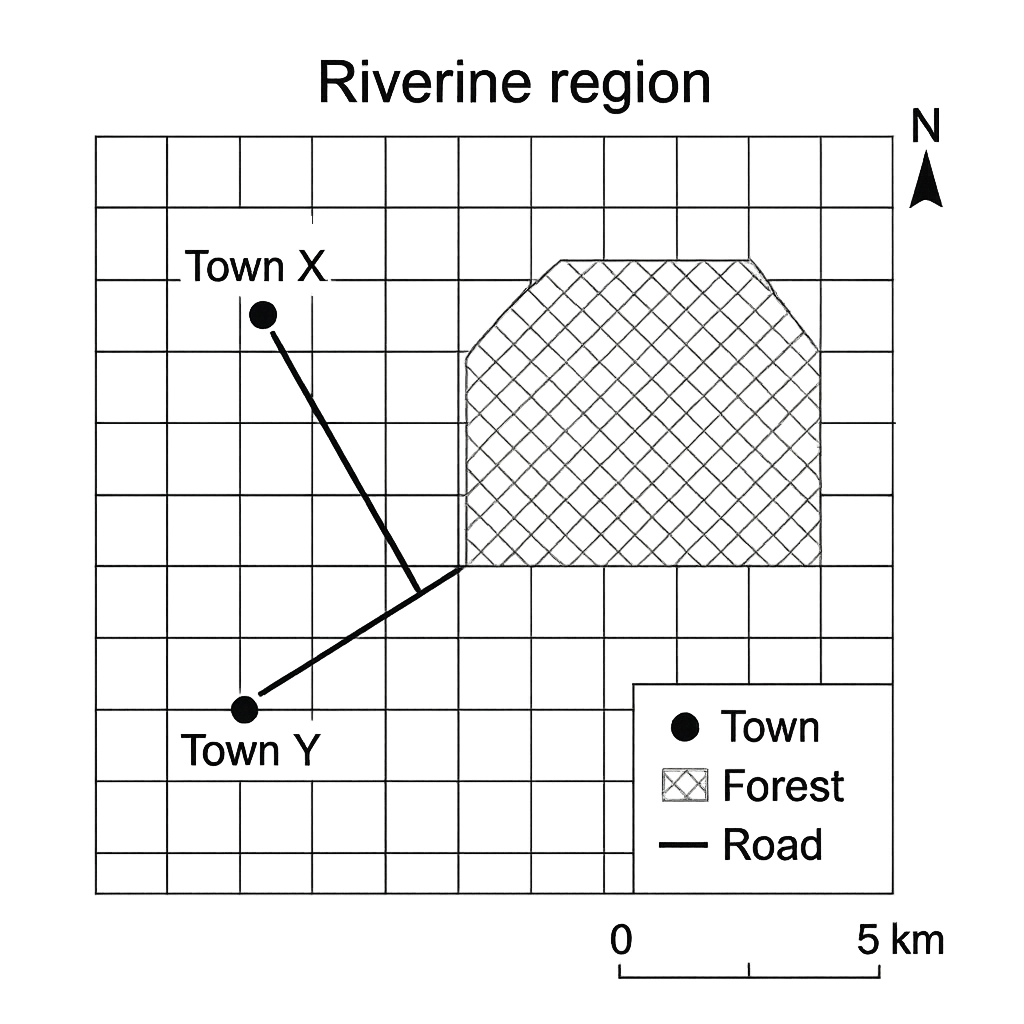
Question 1 View Details
The map shown represents a portion of the Riverine region. The map includes a north arrow, a scale bar where 1 cm corresponds to 5 km, and symbols for a town (filled circle), a forest (cross‑hatched area) and a road (solid line).
Question Parts
(a)
Identify the symbol used for the town and the symbol used for the forest on the map.
(b)
The straight‑line distance between Town X and Town Y measured on the map is 3.6 cm. Calculate the actual distance between the two towns in kilometres.
(c)
From the north arrow, determine the bearing of the road that runs from Town X to Town Z, given that on the map the road makes an angle of 45° measured clockwise from the north direction. Express the bearing in the form N θ° E or S θ° W as appropriate.
(d)
The shaded area on the map represents a forest covering 12 grid squares, where each grid square is 1 cm × 1 cm. Estimate the real area of the forest in square kilometres.
Detailed Essay Solution & Marking Scheme Available

Get the step-by-step mathematical proofs, key points required by examiners, and a comprehensive breakdown from our AI Tutor.
Question 2 View Details
The map below shows the coastal district of Lagos State. The map scale is 1 cm = 0.5 km (i.e., 1 : 50 000). The map includes a grid of 1 cm squares, a road network, a river, three villages (A, B and C), and a rectangular park P.
Question Parts
(a)
The distance measured on the map between Village A and Village B along the road is 7.4 cm. Calculate the road distance in kilometres.
(b)
The rectangular park P shown on the map occupies an area of 8 cm by 5 cm. Determine the actual area of the park in hectares (1 ha = 0.01 km²).
(c)
If a person walks from Village A to Village C following the road that is 12 cm long on the map, and walks at an average speed of 4 km h⁻¹, estimate the time taken for the journey in hours and minutes.
Detailed Essay Solution & Marking Scheme Available

Get the step-by-step mathematical proofs, key points required by examiners, and a comprehensive breakdown from our AI Tutor.

Question 3 View Details
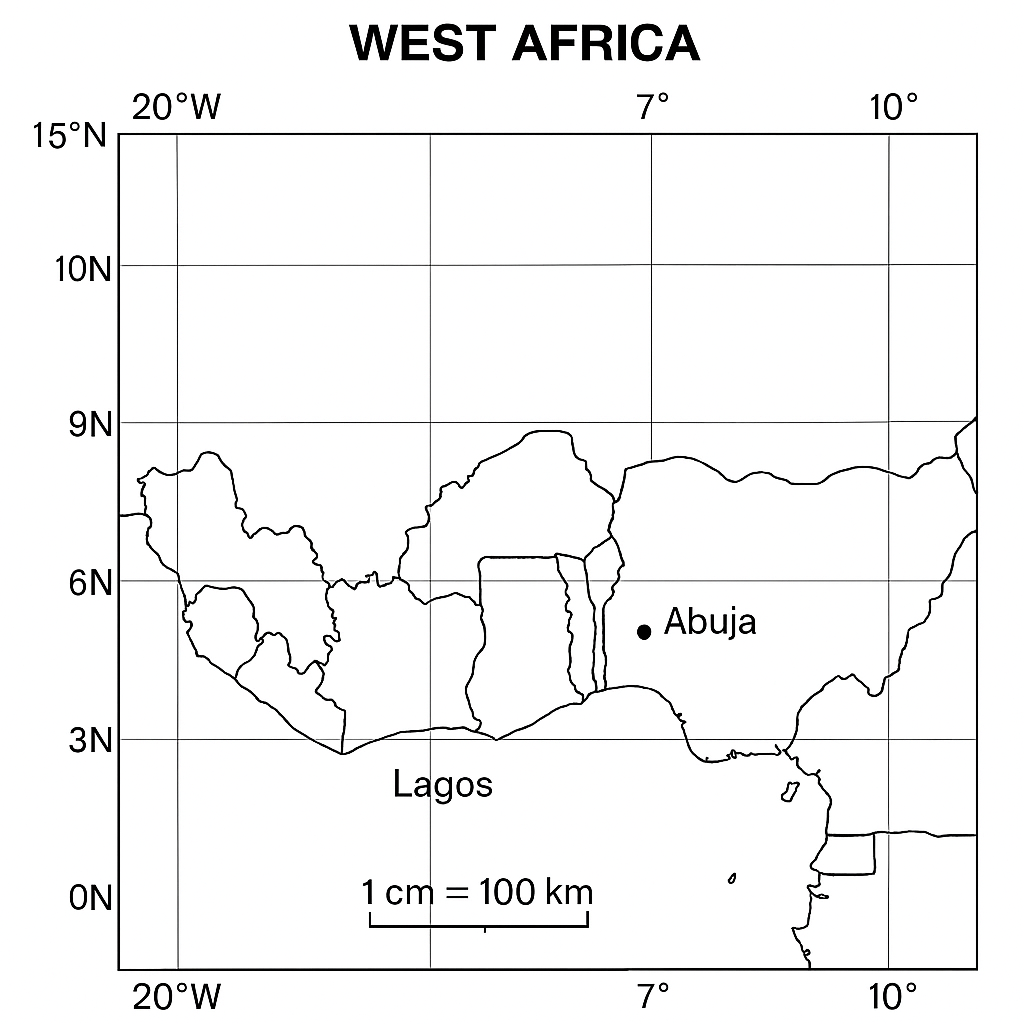
The map shows a part of West Africa with a latitude‑longitude grid. The scale is 1 cm = 100 km. Two towns are marked: - Lagos at 6° N, 3° E - Abuja at 9° N, 7° E Using the information on the map, answer the following:
Question Parts
(a)
Calculate the approximate straight‑line distance between Lagos and Abuja. Use 1° of latitude ≈ 111 km and, for longitude, use 1° ≈ 111 km × cos θ, where θ is the average latitude of the two towns. Show all steps and state any assumptions made.
(b)
Explain how the difference in latitude between the two towns influences their respective climates.
(c)
Discuss two ways in which the map’s scale could affect the accuracy of the distance you calculated in part (a).
Detailed Essay Solution & Marking Scheme Available

Get the step-by-step mathematical proofs, key points required by examiners, and a comprehensive breakdown from our AI Tutor.

Question 4 View Details
The table below gives the monthly average temperature (°C) and total rainfall (mm) recorded at a weather station in southern Nigeria over a typical year. | Month | Avg. Temp (°C) | Rainfall (mm) | |-------|----------------|---------------| | Jan | 28 | 20 | | Feb | 29 | 30 | | Mar | 30 | 70 | | Apr | 31 | 150 | | May | 30 | 220 | | Jun | 28 | 260 | | Jul | 27 | 300 | | Aug | 27 | 280 | | Sep | 28 | 200 | | Oct | 29 | 120 | | Nov | 29 | 60 | | Dec | 28 | 30 | Using this information, answer the following:
Question Parts
(a)
Identify the month with the highest rainfall and explain the atmospheric processes that lead to this peak in the context of West African climate.
(b)
Calculate the mean (average) monthly temperature for the year and comment on the temperature range observed.
(c)
Discuss how the position and seasonal movement of the Inter‑tropical Convergence Zone (ITCZ) influences the overall rainfall pattern shown in the table.
Detailed Essay Solution & Marking Scheme Available

Get the step-by-step mathematical proofs, key points required by examiners, and a comprehensive breakdown from our AI Tutor.

Question 5 View Details
The table below shows the average monthly temperature (°C) and rainfall (mm) recorded at the coastal city of Lagos over a typical year. | Month | Temperature (°C) | Rainfall (mm) | |-------|------------------|---------------| | Jan | 27 | 30 | | Feb | 28 | 35 | | Mar | 27 | 70 | | Apr | 26 | 120 | | May | 25 | 180 | | Jun | 24 | 250 | | Jul | 24 | 300 | | Aug | 25 | 260 | | Sep | 26 | 200 | | Oct | 27 | 120 | | Nov | 27 | 60 | | Dec | 27 | 30 | Using this information, answer the following:
Question Parts
(a)
Determine the Köppen climate classification for Lagos and explain the climatic evidence that leads to your conclusion.
(b)
Identify the two most significant climatic factors that control the seasonal rainfall pattern in Lagos and describe how each factor operates.
(c)
Discuss two likely impacts of a projected 2 °C rise in average temperature on agriculture in Lagos and suggest one practical adaptation measure for each impact.
Detailed Essay Solution & Marking Scheme Available

Get the step-by-step mathematical proofs, key points required by examiners, and a comprehensive breakdown from our AI Tutor.

Question 6 View Details
A civil‑engineering project requires a durable rock material for the foundations of a new bridge across the River Niger. In the project area three rock types are available, with the properties shown below. | Rock | Hardness (Mohs) | Porosity (%) | Weathering resistance | Typical formation environment | |--------|-----------------|--------------|-----------------------|--------------------------------| | Granite| 6‑7 | 0.5 | High | Intrusive igneous | | Basalt | 5‑6 | 1.0 | Moderate | Extrusive igneous | | Shale | 2‑3 | 12 | Low | Clastic sedimentary | Answer the following questions:
Question Parts
(a)
Classify each rock as igneous, sedimentary or metamorphic, giving a brief justification based on the data provided.
(b)
Rank the three rocks in order of suitability for the bridge foundation, explaining the criteria you use for the ranking.
(c)
If the site is exposed to acidic rain, which rock would be most vulnerable to chemical weathering and why? Propose one engineering mitigation to protect the foundation made from that rock.
Detailed Essay Solution & Marking Scheme Available

Get the step-by-step mathematical proofs, key points required by examiners, and a comprehensive breakdown from our AI Tutor.

Question 7 View Details
Landforms in the northern Nigerian plateau are characterised by a mixture of inselbergs, cuesta ridges and lateritic soils.
Question Parts
(a)
Define a cuesta and describe the geological processes that lead to its formation in the context of the northern Nigerian plateau.
(b)
The plateau experiences an average annual rainfall of 850 mm and a mean erosion rate of 0.12 mm yr⁻¹ on the dip‑slope, while the scarp side experiences 0.35 mm yr⁻¹. Using these figures, argue which side of the cuesta is likely to retreat faster and why.
(c)
Discuss two ways in which intensive agriculture and road construction could modify the morphology of the cuesta over the next 50 years, and suggest one mitigation measure for each impact.
Detailed Essay Solution & Marking Scheme Available

Get the step-by-step mathematical proofs, key points required by examiners, and a comprehensive breakdown from our AI Tutor.

Question 8 View Details
The Benue River basin in central Nigeria exhibits a dendritic drainage pattern with a total catchment area of 180 000 km². The basin receives an average runoff coefficient of 0.45 and an annual precipitation of 1 200 mm.
Question Parts
(a)
Calculate the mean annual discharge (in cubic metres per second) that would be expected from the basin, showing all steps.
(b)
The basin is classified as being in a mature stage of development. Explain the geomorphological evidence that supports this classification.
(c)
Climate projections indicate a 10 % increase in annual precipitation and a 15 % decrease in vegetation cover over the next three decades. Evaluate the likely impacts on flood frequency and sediment load, and propose two integrated river‑basin management strategies to address these challenges.
Detailed Essay Solution & Marking Scheme Available

Get the step-by-step mathematical proofs, key points required by examiners, and a comprehensive breakdown from our AI Tutor.

Question 9 View Details
A farmer in northern Nigeria cultivates a 5‑hectare field that lies on a gently sloping sandy‑loam soil. Recent soil tests give the following data: - pH = 5.2 - Organic matter = 1.2 % - Bulk density = 1.45 g cm⁻³ - Available nitrogen = 0.08 % - Available phosphorus = 0.02 % - Available potassium = 0.15 % The area receives an average annual rainfall of 1200 mm and an evapotranspiration of 800 mm. The low‑lying portion of the field experiences seasonal water‑logging, while the upper part shows signs of surface erosion. Using this information, answer the following:
Question Parts
(a)
Identify the major physical and chemical constraints to crop production on this field.
(b)
Explain how each of the constraints identified in (a) influences crop productivity.
(c)
Propose an integrated soil‑management plan that addresses the constraints listed in (a). Include at least three specific measures and justify each.
(d)
Assuming the following response factors for the measures in (c): - Raising pH to 6.5 adds an 8 % yield increase. - Increasing organic matter by 0.5 % raises yield by 5 %. - Reducing bulk density to 1.30 g cm⁻³ adds a 4 % yield increase. - Correcting N, P and K deficiencies adds a further 6 % increase. - Improving drainage and controlling erosion together contribute an additional 2 % increase. Calculate the overall percentage yield increase the farmer can expect if all measures are fully implemented.
Detailed Essay Solution & Marking Scheme Available

Get the step-by-step mathematical proofs, key points required by examiners, and a comprehensive breakdown from our AI Tutor.

Question 10 View Details
A national park situated in the Guinea savanna zone of Nigeria contains three principal vegetation types: - Grassland: 45 % of the park area, species richness 120 species. - Shrubland: 35 % of the park area, species richness 80 species. - Gallery forest along the riverine corridor: 20 % of the park area, species richness 200 species. The park experiences a mean annual rainfall of 1400 mm and a mean temperature of 27 °C. Human activities include seasonal grazing, small‑scale fire setting for pasture renewal, and limited timber extraction from the gallery forest. Using this information, answer the following:
Question Parts
(a)
Calculate the absolute area (in km²) occupied by each vegetation type if the total park area is 150 km². Then discuss the main abiotic factors that explain the observed distribution pattern.
Detailed Essay Solution & Marking Scheme Available

Get the step-by-step mathematical proofs, key points required by examiners, and a comprehensive breakdown from our AI Tutor.

Master the Exam!

You've seen a preview, but there are thousands more questions plus AI tutor to break down complex solutions.

Unlock Full Access Available for Android & Windows
Help others prepare! Share this practice hub:
Chat with Support