waec model questions vol1 2019 geography | Essay

Prepare for your exams with waec model questions vol1 questions? Reviewing past/model questions is one of the most effective ways to guarantee a high score. This practice hub features authentic 2019 geography (Essay) questions designed to simulate the real exam environment.

Practice these randomly selected questions to test your readiness.
Question 1 View Details
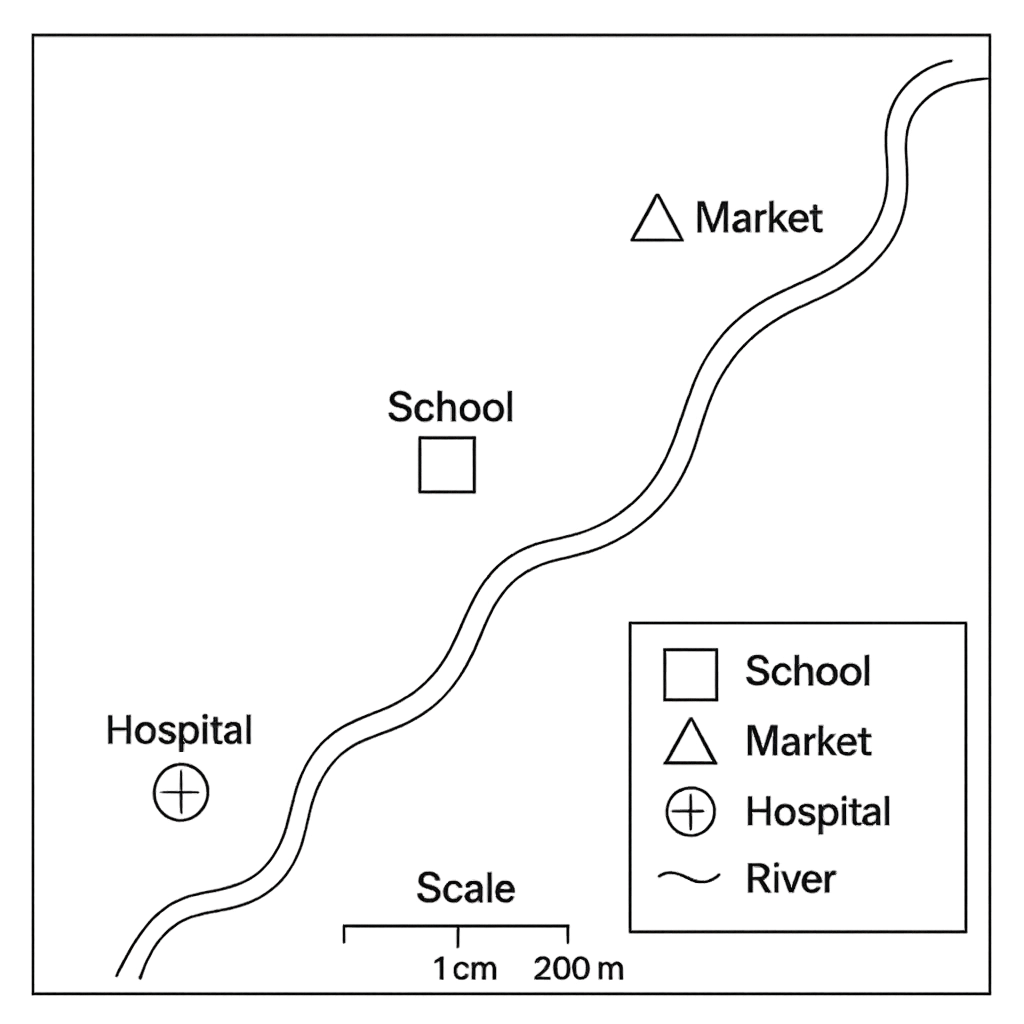
The map below shows part of the town of Ikot Ekpene. The map scale is 1 cm : 200 m. The legend indicates the symbols used for the school (□), the market (△), the hospital (⨂) and the river (wavy line).
Question Parts
(a)
State the cardinal direction of the market from the school.
(b)
The distance between the school and the hospital as measured on the map is 3.5 cm. Calculate the actual distance in kilometres.
(c)
The river runs between points A and B on the map. The length of the river on the map between these points is 4.2 cm. Estimate the real length of the river in kilometres and comment on the possible error if the river meanders.
Detailed Essay Solution & Marking Scheme Available

Get the step-by-step mathematical proofs, key points required by examiners, and a comprehensive breakdown from our AI Tutor.

Question 2 View Details
The map below depicts the agricultural zone of a district. The map scale is 1 cm : 500 m. The map shows a rectangular farm plot ABCD, a circular pond with centre O, and a road that forms a right‑angled triangle with its legs measured on the map.
Question Parts
(a)
If the dimensions of the farm plot on the map are AB = 6 cm and BC = 4 cm, calculate the actual area of the farm in square kilometres.
(b)
The pond is shown as a circle with radius 1.5 cm on the map. Assuming the pond is a perfect cylinder 2 m deep, determine its actual volume in cubic metres.
(c)
A road forms a right‑angled triangle on the map with legs measuring 3 cm and 4 cm. Using the scale, find the actual length of the hypotenuse in metres and then express it in kilometres.
(d)
Discuss how changing the map scale to 1 cm : 250 m would affect the representation of the farm plot area and the pond volume on the map.
Detailed Essay Solution & Marking Scheme Available

Get the step-by-step mathematical proofs, key points required by examiners, and a comprehensive breakdown from our AI Tutor.

Question 3 View Details
A weather station located at 6°30' N latitude and 3°20' E longitude recorded a temperature of 28 °C on a clear day. Another station at 2°15' S latitude and 7°45' W longitude recorded a temperature of 24 °C at the same time. Using the information provided, answer the following:
Question Parts
(a)
State the hemispheres (Northern or Southern, Eastern or Western) in which each station is situated.
(b)
Calculate the approximate north‑south (meridional) distance between the two stations. Use 1° latitude ≈ 111 km.
(c)
Determine the approximate east‑west (zonal) distance between the stations. Use the mean latitude of the two stations to convert longitude difference to distance, where 1° longitude = 111 km × cos(mean latitude). Show all steps.
(d)
Discuss two sources of error that could affect the accuracy of the distances you have calculated.
Detailed Essay Solution & Marking Scheme Available

Get the step-by-step mathematical proofs, key points required by examiners, and a comprehensive breakdown from our AI Tutor.

Question 4 View Details
A synoptic weather chart for the West African region shows the following data: - A closed isobar of 1010 hPa over Lagos. - A closed isobar of 1002 hPa over Accra. - A closed isobar of 1006 hPa over Kumasi. - The isobars form a roughly semi‑circular pattern with the lowest pressure centre over Accra. - Wind barbs on the chart indicate winds blowing from the northeast over Lagos and from the southeast over Kumasi. Answer the questions below:
Question Parts
(a)
Identify the type of pressure system represented on the chart and justify your answer.
(b)
Using the isobar values, estimate the magnitude of the pressure gradient force (PGF) between Lagos and Accra. Assume the straight‑line distance between the two cities is 460 km and use PGF ≈ Δp / Δd, where Δp is the pressure difference in hPa and Δd is the distance in km.
(c)
Explain why the wind direction over Lagos is from the northeast even though the pressure gradient points towards the southwest.
(d)
Predict the likely weather conditions (e.g., cloud type, precipitation) over Accra and justify your prediction using the chart information.
Detailed Essay Solution & Marking Scheme Available

Get the step-by-step mathematical proofs, key points required by examiners, and a comprehensive breakdown from our AI Tutor.

Question 5 View Details
The table below summarises the climatic data recorded over a twelve‑month period for a coastal region in southwestern Nigeria: | Month | Avg. Max Temp (°C) | Avg. Min Temp (°C) | Avg. Rainfall (mm) | Avg. Relative Humidity (%) | |-------|-------------------|--------------------|--------------------|----------------------------| | Jan | 30 | 22 | 15 | 78 | | Feb | 31 | 23 | 20 | 80 | | Mar | 32 | 24 | 45 | 84 | | Apr | 33 | 25 | 120 | 88 | | May | 33 | 25 | 210 | 92 | | Jun | 32 | 24 | 260 | 94 | | Jul | 31 | 23 | 300 | 95 | | Aug | 31 | 23 | 280 | 94 | | Sep | 31 | 23 | 200 | 90 | | Oct | 31 | 23 | 110 | 85 | | Nov | 30 | 22 | 50 | 80 | | Dec | 30 | 22 | 20 | 78 | Using this information, answer the following questions:
Question Parts
(a)
Analyse the seasonal variation in temperature and rainfall and explain the atmospheric processes responsible for the observed pattern.
(b)
Discuss two major impacts of the observed climate pattern on agricultural practices in the region.
(c)
Propose two adaptation strategies that could mitigate the adverse effects of climate variability on food security in the area.
Detailed Essay Solution & Marking Scheme Available

Get the step-by-step mathematical proofs, key points required by examiners, and a comprehensive breakdown from our AI Tutor.

Question 6 View Details
A geologist examines an outcrop on the northern flank of the Jos Plateau. The following observations are recorded: - The rock is massive, coarse‑grained and displays interlocking quartz, feldspar and biotite crystals. - Grain size is roughly 2–5 mm; the rock exhibits a porphyritic texture with larger feldspar phenocrysts set in a finer matrix. - The rock is strongly jointed, with joints trending NW‑SE. - Minor foliation is observed, striking NE‑SW and dipping gently to the SW. - The region is known to have experienced extensive volcanic activity during the Cretaceous and is presently situated within a Precambrian basement complex. Answer the questions that follow:
Question Parts
(a)
Identify the rock type(s) present and justify your classification using the described characteristics.
(b)
Explain the geological processes that led to the formation of the identified rock(s), linking them to the regional tectonic setting.
(c)
Evaluate the suitability of the rock for use as a construction material and suggest two engineering measures that could improve its performance in building applications.
() Assess durability, strength and weathering resistance.
() Recommend two engineering treatments or design modifications.
Detailed Essay Solution & Marking Scheme Available

Get the step-by-step mathematical proofs, key points required by examiners, and a comprehensive breakdown from our AI Tutor.

Question 7 View Details
The table below summarises the main physical characteristics of three major landforms that occur in the coastal state of Bayelsa. | Landform | Average Elevation (m) | Mean Slope (°) | Dominant Soil Type | Average Annual Rainfall (mm) | |-------------------|-----------------------|----------------|--------------------|------------------------------| | Coastal Plain | 15 | 2 | Sandy loam | 2100 | | Lowland Basin | 120 | 5 | Lateritic | 1800 | | Plateau | 650 | 12 | Ferruginous | 1500 | Using this information, answer the following questions:
Question Parts
(a)
Compare the three landforms in terms of: (i) slope gradient, (ii) soil fertility, and (iii) vulnerability to erosion.
(b)
Considering the data, which landform offers the greatest potential for intensive agriculture? Justify your choice with reference to at least two physical factors.
(c)
Propose two land‑use management measures to reduce erosion on the most vulnerable landform and explain how they work.
Detailed Essay Solution & Marking Scheme Available

Get the step-by-step mathematical proofs, key points required by examiners, and a comprehensive breakdown from our AI Tutor.

Question 8 View Details
A river basin in the northern part of Nigeria has the characteristics shown in the table. | Parameter | Value | |-----------------------------------|-------------------------------------| | Length of main river (L) | 120 km | | Elevation at source (Es) | 800 m above sea level | | Elevation at mouth (Em) | 500 m above sea level | | Basin area (A) | 2 000 km² | | Mean annual rainfall (R) | 1 500 mm | | Discharge at upstream station (Q₁)| 15 m³/s | | Discharge at mid‑stream station (Q₂)| 45 m³/s | | Discharge at downstream station (Q₃)| 120 m³/s | Using this information, answer the following questions:
Question Parts
(a)
Calculate the average gradient of the river in metres per kilometre (m/km).
(b)
Using the rational method, estimate the peak discharge (Qₚ) for the basin. Assume a runoff coefficient C = 0.6 and a design rainfall intensity I = 30 mm h⁻¹ acting over the entire basin. Show all steps.
(c)
Discuss two flood‑mitigation measures that would be appropriate for this basin, linking each measure to the calculated gradient and peak discharge.
Detailed Essay Solution & Marking Scheme Available

Get the step-by-step mathematical proofs, key points required by examiners, and a comprehensive breakdown from our AI Tutor.

Master the Exam!

You've seen a preview, but there are thousands more questions plus AI tutor to break down complex solutions.

Unlock Full Access Available for Android & Windows
Help others prepare! Share this practice hub:
Chat with Support