neco model questions vol1 2025 geography | Essay

Prepare for your exams with neco model questions vol1 questions? Reviewing past/model questions is one of the most effective ways to guarantee a high score. This practice hub features authentic 2025 geography (Essay) questions designed to simulate the real exam environment.

Practice these randomly selected questions to test your readiness.
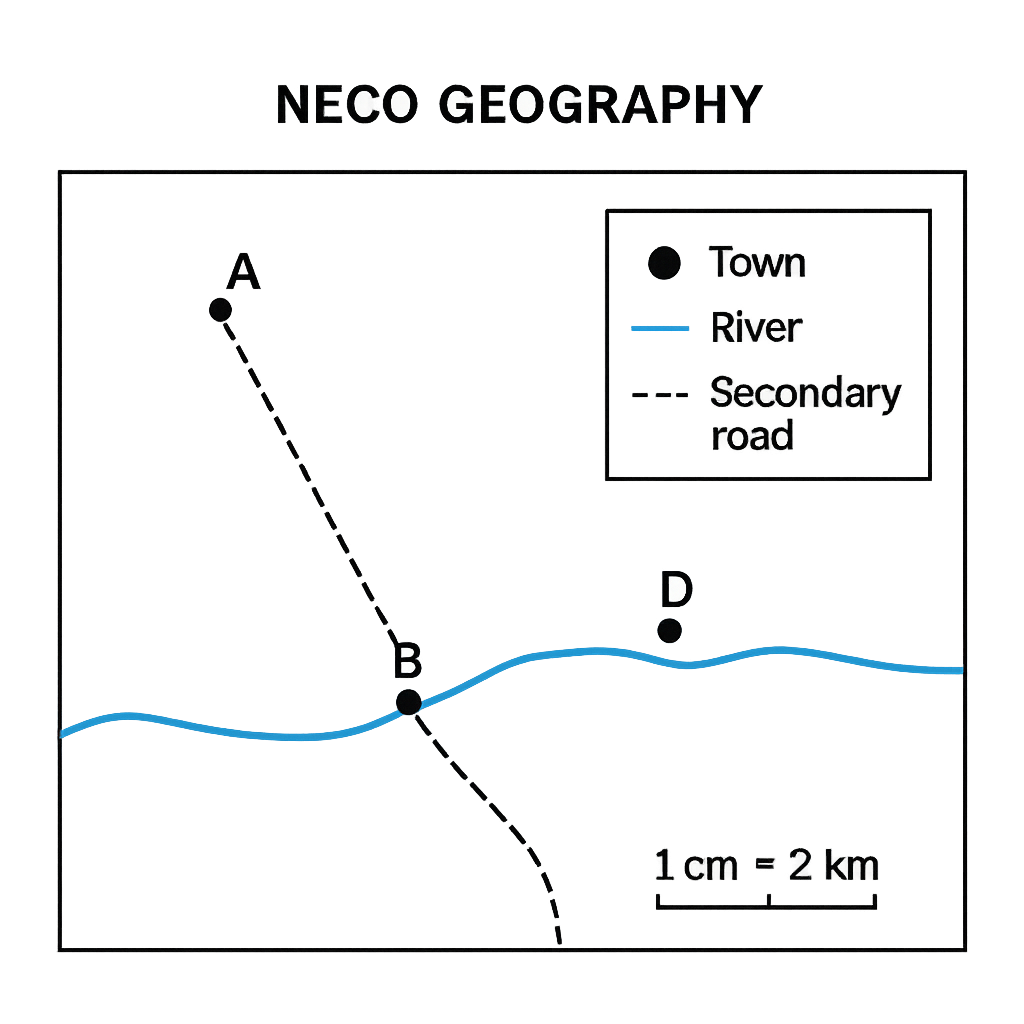
Question 1 View Details
The map shown represents a rural district. The map scale is 1 cm = 2 km. The legend indicates that a solid black circle denotes a town, a blue line denotes a river, and a dashed line denotes a secondary road. Town A is located at the north‑west corner of the map, Town B lies directly south of A, and Town C is situated to the south‑east of A. The straight‑line distance on the map between Town A and Town C is 7.2 cm and the bearing of the line AC measured clockwise from true north is 135°. A proposed new road is to be built from Town B to a point D that is 3 cm directly east of B on the map.
Question Parts
(a)
Calculate the actual ground distance between Town A and Town C.
(b)
State the bearing of Town C from Town A in degrees.
(c)
Identify two land‑use types shown on the map and explain the symbols used for each.
(d)
Determine the real length of the proposed road from Town B to point D.
(e)
Discuss one advantage of using this map for planning agricultural activities in the district.
Detailed Essay Solution & Marking Scheme Available

Get the step-by-step mathematical proofs, key points required by examiners, and a comprehensive breakdown from our AI Tutor.
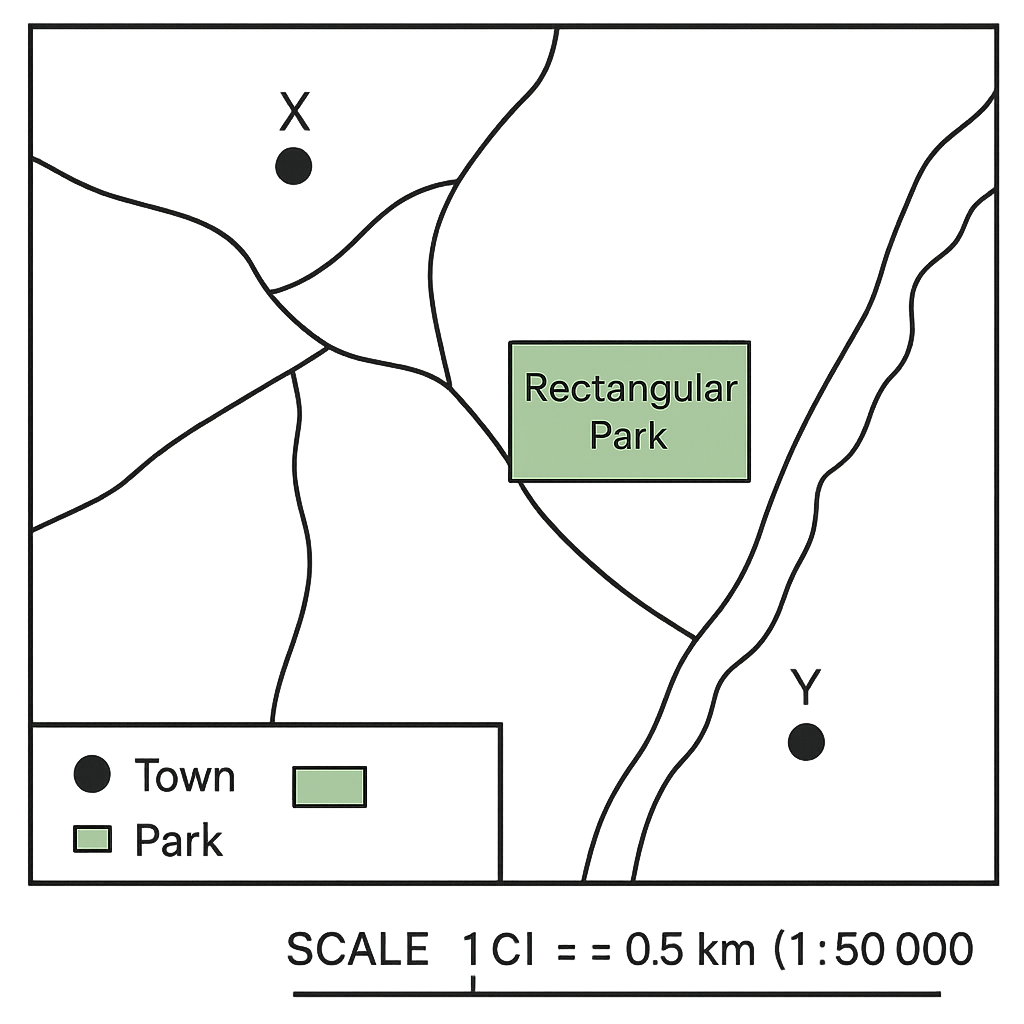
Question 2 View Details
The map below shows part of a coastal city. The map scale is 1 : 50 000 (i.e., 1 cm on the map represents 0.5 km on the ground). Town X and Town Y are marked on the map. The straight‑line distance between X and Y measured on the map is 6.0 cm. A rectangular park is shown on the map with its length measured as 3.0 cm and its width as 2.0 cm.
Question Parts
(a)
Calculate the actual ground distance between Town X and Town Y in kilometres.
(b)
Determine the real area of the rectangular park in hectares (1 ha = 0.01 km²).
(c)
Express the map scale as a representative fraction (RF) and as a verbal scale (e.g., "1 cm : ___ km").
(d)
Discuss one advantage and one disadvantage of using a large‑scale map (e.g., 1 : 25 000) compared with the present map for urban planning of new residential estates.
Detailed Essay Solution & Marking Scheme Available

Get the step-by-step mathematical proofs, key points required by examiners, and a comprehensive breakdown from our AI Tutor.

Question 3 View Details
A geographer is comparing two Nigerian towns, Town A and Town B. Town A lies at 7° 30' N latitude and 5° 00' E longitude. Town B lies at 12° 15' N latitude and 8° 45' E longitude.
Question Parts
(a)
Calculate the approximate north‑south angular separation between the two towns in degrees, minutes and seconds.
(b)
Determine the time difference (in minutes) between the local solar noon of Town A and Town B, assuming the Earth rotates 15° of longitude per hour.
(c)
Explain, using the latitudinal positions, which town is more likely to experience a higher maximum temperature during the June solstice and why.
Detailed Essay Solution & Marking Scheme Available

Get the step-by-step mathematical proofs, key points required by examiners, and a comprehensive breakdown from our AI Tutor.

Question 4 View Details
The following weather observations were recorded at a coastal station in southwestern Nigeria during three consecutive days: | Day | Maximum Temperature (°C) | Minimum Temperature (°C) | Relative Humidity (%) | Wind Speed (km/h) | Cloud Cover | |-----|--------------------------|--------------------------|-----------------------|-------------------|-------------| | 1 | 31 | 23 | 78 | 12 | Mostly clear | | 2 | 28 | 22 | 85 | 20 | Scattered clouds | | 3 | 26 | 21 | 92 | 8 | Overcast | Using the data above, answer the questions that follow.
Question Parts
(a)
Calculate the mean daily temperature for each day and identify the day with the greatest diurnal temperature range.
(b)
Discuss how the changes in relative humidity and wind speed over the three days influence the perceived comfort level, referencing the concept of the heat index.
(c)
Based on the cloud cover observations, infer the likely type of air mass affecting the station on Day 3 and justify your answer.
Detailed Essay Solution & Marking Scheme Available

Get the step-by-step mathematical proofs, key points required by examiners, and a comprehensive breakdown from our AI Tutor.

Question 5 View Details
The table below shows the average monthly temperature (°C) and rainfall (mm) recorded at the town of Umuahia over a typical year. | Month | Avg. Temp (°C) | Avg. Rainfall (mm) | |-------|----------------|--------------------| | Jan | 28 | 250 | | Feb | 27 | 220 | | Mar | 26 | 180 | | Apr | 25 | 150 | | May | 24 | 120 | | Jun | 23 | 80 | | Jul | 22 | 60 | | Aug | 22 | 70 | | Sep | 23 | 100 | | Oct | 25 | 150 | | Nov | 26 | 200 | | Dec | 27 | 240 | Using the data above, answer the following questions:
Question Parts
(a)
Identify the Köppen climate classification for Umuahia and justify your choice with reference to the table.
(b)
Explain two major atmospheric or geographic factors that influence the climate pattern shown in the table.
(c)
Discuss two impacts of this climate on agricultural practices in the region.
(d)
Propose two adaptation strategies that farmers could adopt to mitigate the adverse effects of the identified climate.
Detailed Essay Solution & Marking Scheme Available

Get the step-by-step mathematical proofs, key points required by examiners, and a comprehensive breakdown from our AI Tutor.

Question 6 View Details
A geologist examined three rock samples collected from different locations on the Jos Plateau. The observations for each sample are given below. Sample A: Coarse‑grained, interlocking crystals of quartz and feldspar visible to the naked eye; hardness 6–7 on the Mohs scale. Sample B: Fine‑grained, dark, foliated rock that splits easily into thin sheets; contains abundant mica and chlorite. Sample C: Massive, porous rock composed mainly of calcium carbonate; contains fragmented shell fossils and feels relatively soft. Answer the following questions:
Question Parts
(a)
Classify each sample as igneous, sedimentary, or metamorphic.
(b)
Explain the principal formation process for each rock type identified in part (a).
(c)
Discuss the suitability of each rock for use as a building material, giving one advantage and one limitation for each.
(d)
Considering the semi‑arid climate of the Jos Plateau (marked seasonal temperature variation and occasional heavy rain), evaluate which of the three rocks is most susceptible to weathering and explain why.
Detailed Essay Solution & Marking Scheme Available

Get the step-by-step mathematical proofs, key points required by examiners, and a comprehensive breakdown from our AI Tutor.

Question 7 View Details
The coastal region of Baytown displays a series of landforms that have developed under the combined influence of marine waves, tides and fluvial processes.
Question Parts
(a)
Identify three major coastal landforms that are likely to be found in Baytown and explain the dominant geomorphological process responsible for the formation of each.
(b)
Discuss how relative sea‑level change over the last 10,000 years could have altered the spatial arrangement of the landforms identified in part (a).
(c)
Evaluate two possible impacts of these coastal landforms on human settlement in Baytown and propose one management strategy to mitigate a negative impact.
Detailed Essay Solution & Marking Scheme Available

Get the step-by-step mathematical proofs, key points required by examiners, and a comprehensive breakdown from our AI Tutor.

Question 8 View Details
River X drains a catchment of 2,500 km² situated in a tropical savanna climate. The area receives an average annual rainfall of 1,200 mm, of which 30 % is lost to evapotranspiration. The measured mean discharge at the river outlet is 45 m³ s⁻¹.
Question Parts
(a)
Calculate the total volume of water supplied by rainfall to the catchment in one year and the volume that becomes runoff.
(b)
Using the mean discharge, estimate the annual runoff volume and compare it with the value obtained in part (a). State possible reasons for any discrepancy.
(c)
A small hydro‑electric scheme requires a minimum annual runoff of 1.2 ×10⁹ m³. Based on your calculations, assess the feasibility of the scheme and recommend one measure to increase runoff reliability.
(d)
Explain two ways in which the drainage pattern of the catchment influences the distribution of soil fertility.
Detailed Essay Solution & Marking Scheme Available

Get the step-by-step mathematical proofs, key points required by examiners, and a comprehensive breakdown from our AI Tutor.

Master the Exam!

You've seen a preview, but there are thousands more questions plus AI tutor to break down complex solutions.

Unlock Full Access Available for Android & Windows
Help others prepare! Share this practice hub:
Chat with Support