Neco Model Questions Vol1 2022 Mathematics Question 35
Practice objective / multiple choice question 35 from the 2022 Neco Model Questions Vol1 Mathematics examination.
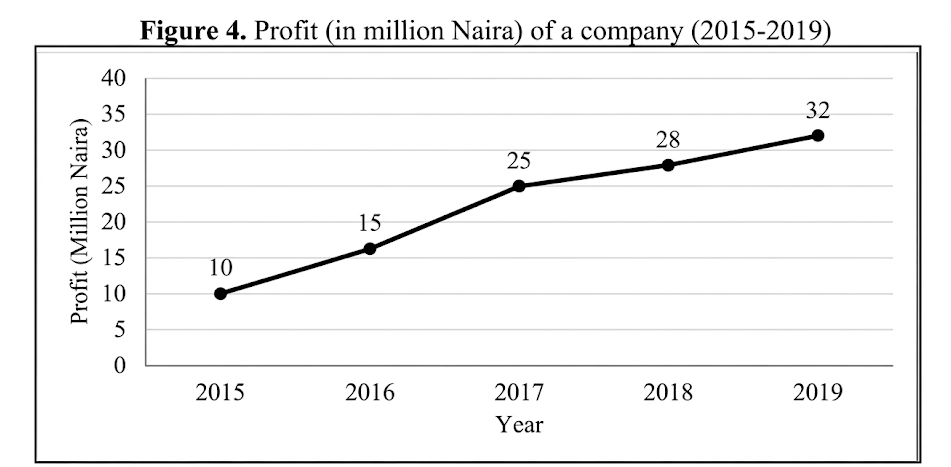
The line graph shows the profit (in million Naira) of a company from 2015 to 2019 as given in the diagram. Determine the year in which the average annual increase in profit over the two preceding years was greatest, and state that average increase (to one decimal place).
Answer Options
About This Question
This is Neco Model Questions Vol1 2022 Mathematics Question 35. It is one of the objective questions from the 2022 Neco Model Questions Vol1 Mathematics examination.
Difficulty level: Medium .
Master the Exam!
You've seen a preview, but there are thousands more questions plus AI tutor to break down complex solutions.