neco model questions vol1 2020 geography | Objective

Prepare for your exams with neco model questions vol1 questions? Reviewing past/model questions is one of the most effective ways to guarantee a high score. This practice hub features authentic 2020 geography (Objective) questions designed to simulate the real exam environment.

Practice these randomly selected questions to test your readiness.

Question 1 View Details
A soil sample contains \(45\%\) sand. The percentage of silt is twice that of clay. Determine the percentage of clay in the sample and then calculate the overall field capacity of the soil, given that the field capacity contributions are \(0.10\ \text{cm}^3\text{cm}^{-3}\) for sand, \(0.20\ \text{cm}^3\text{cm}^{-3}\) for silt and \(0.40\ \text{cm}^3\text{cm}^{-3}\) for clay.
A. 0.210 cm³/cm³ (approximately)
B. 0.150 cm³/cm³ (approximately)
C. 0.180 cm³/cm³ (approximately)
Correct D. 0.192 cm³/cm³ (approximately)

Correct Answer: D

Want to see the full step-by-step solution? Unlock AI Explanation & Analytics
Question 2 View Details
A locomotive can exert a maximum tractive effort of \(150\ \text{kN}\). The train consists of a locomotive weighing \(80\ \text{t}\) and a number of identical wagons each weighing \(20\ \text{t}\). Rolling resistance is \(5\ \text{N}\) per tonne and gradient resistance is \(10\ \text{N}\) per tonne per percent gradient. The train must climb a \(2\%\) gradient. What is the greatest number of wagons that can be attached without exceeding the locomotive's tractive effort?
A. 320 wagons
Correct B. 296 wagons
C. 280 wagons
D. 250 wagons

Correct Answer: B

Want to see the full step-by-step solution? Unlock AI Explanation & Analytics
Question 3 View Details
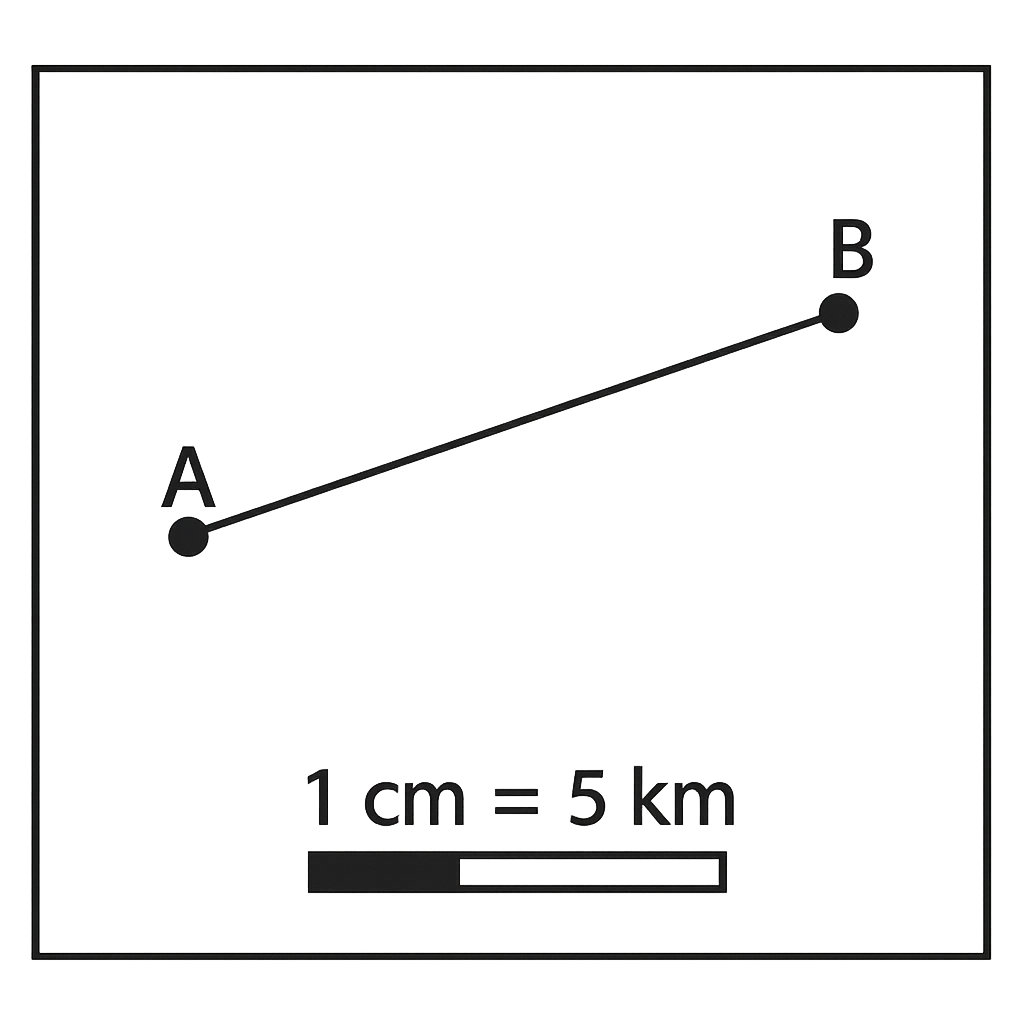
On the map, the scale is \(1\ \text{cm} : 5\ \text{km}\). The straight‑line distance between Town A and Town B measures \(7.2\ \text{cm}\) on the map. What is the actual distance between the towns in kilometres?
A. 39.6 km
B. 28 km
Correct C. 36 km
D. 43.2 km

Correct Answer: C

Want to see the full step-by-step solution? Unlock AI Explanation & Analytics
Question 4 View Details
The concentration of volcanic ash at a distance \(d\) km from the vent is given by \(C = \frac{8000}{d^{2}}\) kg·km⁻². Health guidelines consider concentrations above \(2\) kg·km⁻² hazardous. (a) Determine the minimum distance from the volcano at which the ash concentration falls below the hazardous level. (b) If a town is located \(30\) km downwind, calculate the ash concentration there and state by what percentage it exceeds the hazardous limit.
A. a) ≈56.6 km; b) concentration ≈8.0 kg·km⁻², about 300 % above the hazardous limit
B. a) ≈70.0 km; b) concentration ≈9.0 kg·km⁻², about 350 % above the hazardous limit
C. a) ≈60.0 km; b) concentration ≈7.5 kg·km⁻², about 275 % above the hazardous limit
Correct D. a) ≈63.3 km; b) concentration ≈8.9 kg·km⁻², about 344 % above the hazardous limit

Correct Answer: D

Want to see the full step-by-step solution? Unlock AI Explanation & Analytics
Question 5 View Details
A road on a map runs from point X to point Y with a bearing of N 30° E. The straight‑line distance between X and Y is \(12\) km. Determine the northward (vertical) and eastward (horizontal) components of this displacement.
A. Northward ≈6 km, Eastward = 10.4 km
Correct B. Northward ≈10.4 km, Eastward = 6 km
C. Northward ≈9.8 km, Eastward = 7.2 km
D. Northward ≈11.0 km, Eastward = 4.5 km

Correct Answer: B

Want to see the full step-by-step solution? Unlock AI Explanation & Analytics
Question 6 View Details
A farmer has 20 hectares of land to allocate between maize (M) and beans (B). Maize yields 3.2 tonnes per hectare and sells for \(\,250{,}000\) Naira per tonne; beans yield 1.8 tonnes per hectare and sell for \(\,350{,}000\) Naira per tonne. Each hectare of maize requires 5,000 m³ of water and each hectare of beans requires 3,000 m³. The farm has a total water supply of 80,000 m³. At least 30 % of the land must be planted to beans for soil health. What is the greatest possible area (in hectares) that can be devoted to maize while meeting all constraints?
A. 8
Correct B. 10
C. 9
D. 11

Correct Answer: B

Want to see the full step-by-step solution? Unlock AI Explanation & Analytics
Question 7 View Details
A small factory produces fertilizer bags. Fixed costs are \(2{,}000{,}000\) Naira per month. Variable cost per bag is \(150\) Naira. Each bag sells for \(250\) Naira. The government imposes a 5\% sales tax on total revenue and a 2\% environmental levy on profit before tax. What is the minimum number of bags the factory must produce each month to achieve a net profit of at least \(500{,}000\) Naira after all deductions?
A. 29000
B. 28000
Correct C. 28800
D. 28500

Correct Answer: C

Want to see the full step-by-step solution? Unlock AI Explanation & Analytics
Question 8 View Details
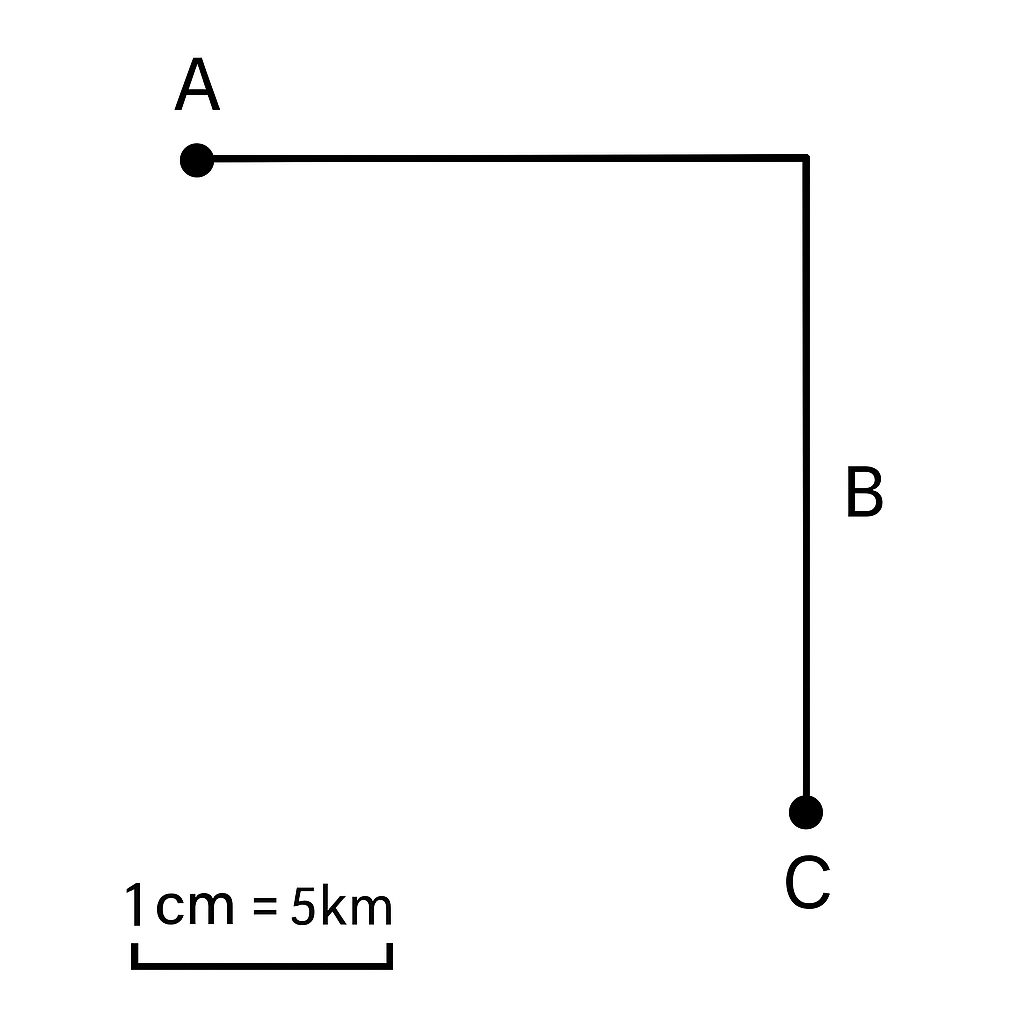
A map uses a scale of 1 cm : 5 km. The distance between towns A and B is 8 cm, the distance between towns B and C is 6 cm, and the angle at B (\(\angle ABC\)) is a right angle. Using the map, determine the straight‑line distance between towns A and C in kilometres.
A. 60
B. 70
Correct C. 50
D. 40

Correct Answer: C

Want to see the full step-by-step solution? Unlock AI Explanation & Analytics
Question 9 View Details
A river drops from an elevation of 350 m at point X to 110 m at point Y over a horizontal distance of 12 km.\n(a) Calculate the average gradient of the river as a percentage.\n(b) The river's average flow speed (in m s⁻¹) is given by \(v = 0.5\sqrt{G}\), where \(G\) is the gradient percentage. Estimate the time (in hours, to one decimal place) for a water parcel to travel from X to Y, assuming the river length is the straight‑line distance between the two points.
Correct A. Gradient = 2%; Travel time ≈ 4.7 hours
B. Gradient = 2%; Travel time ≈ 5.5 hours
C. Gradient = 3%; Travel time ≈ 3.9 hours
D. Gradient = 1.5%; Travel time ≈ 5.2 hours

Correct Answer: A

Want to see the full step-by-step solution? Unlock AI Explanation & Analytics
Question 10 View Details
The following are the average monthly temperatures (°C) and precipitation (mm) for a location:\n\n\begin{tabular}{c|cccccccccccc}\nMonth & Jan & Feb & Mar & Apr & May & Jun & Jul & Aug & Sep & Oct & Nov & Dec \\ \hline\nTemp (°C) & 28 & 30 & 32 & 34 & 35 & 33 & 31 & 30 & 29 & 28 & 27 & 26 \\ \nPrecip (mm) & 5 & 10 & 20 & 40 & 80 & 120 & 150 & 140 & 80 & 40 & 15 & 5 \\ \n\end{tabular}\n\n(a) Find the annual mean temperature.\n(b) Find the total annual precipitation.\n(c) Using the Köppen classification, identify the climate type (choose among Aw, Am, Af, Cw, etc.) given that a month is considered dry if its precipitation is less than \(100 - \frac{P_{annual}}{25}\) mm, and a tropical climate requires all monthly mean temperatures above 18°C. If the annual precipitation exceeds 2000 mm the climate is Af; otherwise, if a dry month exists it is Aw, else Am.
A. Mean temp = 30.3°C; Total precip = 705 mm; Climate type = Am
B. Mean temp = 30.3°C; Total precip = 650 mm; Climate type = Aw
C. Mean temp = 29.8°C; Total precip = 705 mm; Climate type = Aw
Correct D. Mean temp = 30.3°C; Total precip = 705 mm; Climate type = Aw

Correct Answer: D

Want to see the full step-by-step solution? Unlock AI Explanation & Analytics
Question 11 View Details
A location is at an altitude of 1200 m. The mean sea‑level temperature is 30°C and the environmental lapse rate is 6.5°C per 1000 m. The average annual rainfall is 1200 mm. Using the classification criteria: \(\text{Rainfall} > 1500\text{ mm} \rightarrow \text{Forest}\); \(800\text{ mm} \le \text{Rainfall} \le 1500\text{ mm}\) and \(\text{Adjusted temperature} > 20°C \rightarrow \text{Savanna}\); otherwise \text{Grassland}, determine the dominant vegetation type at the location.
Correct A. Savanna
B. Grassland
C. Desert
D. Forest

Correct Answer: A

Want to see the full step-by-step solution? Unlock AI Explanation & Analytics
Question 12 View Details
Three environmental hazards affect a region. Their annual probabilities (p), impact ratings (I) on a 1-5 scale, and vulnerability factors (V) are:\n\n- Flood: p = 0.08, I = 4, V = 1.2\n- Landslide: p = 0.03, I = 5, V = 1.5\n- Drought: p = 0.12, I = 3, V = 1.0\n\nRisk for each hazard is calculated as \(R = p \times I\). The weighted risk is \(W = R \times V\). Identify the hazard that contributes the greatest weighted risk to the region.
A. Landslide
B. Drought
Correct C. Flood
D. Wildfire

Correct Answer: C

Want to see the full step-by-step solution? Unlock AI Explanation & Analytics
Question 13 View Details
Region A and Region B are being evaluated for the cultivation of Crop X, which requires an annual rainfall between 900 mm and 1100 mm and prefers low population density (< 50 persons/km²). The data are:\n\n- Region A: population density = 45 persons/km², GDP per capita = $1,500, annual rainfall = 950 mm\n- Region B: population density = 70 persons/km², GDP per capita = $2,000, annual rainfall = 1,050 mm\n\nA suitability index (SI) is calculated as follows:\n\n\(SI = 0.5\times R_f + 0.3\times P_f + 0.2\times G_f\)\n\nwhere \(R_f = 1\) if rainfall is within the required range, otherwise 0; \(P_f = 1\) if density < 50, otherwise 0; and \(G_f = \frac{\text{maxGDP} - \text{GDP}}{\text{maxGDP} - \text{minGDP}}\). Determine which region has the higher suitability index for Crop X.
A. Region B
B. Neither region
Correct C. Region A
D. Both regions

Correct Answer: C

Want to see the full step-by-step solution? Unlock AI Explanation & Analytics
Question 14 View Details
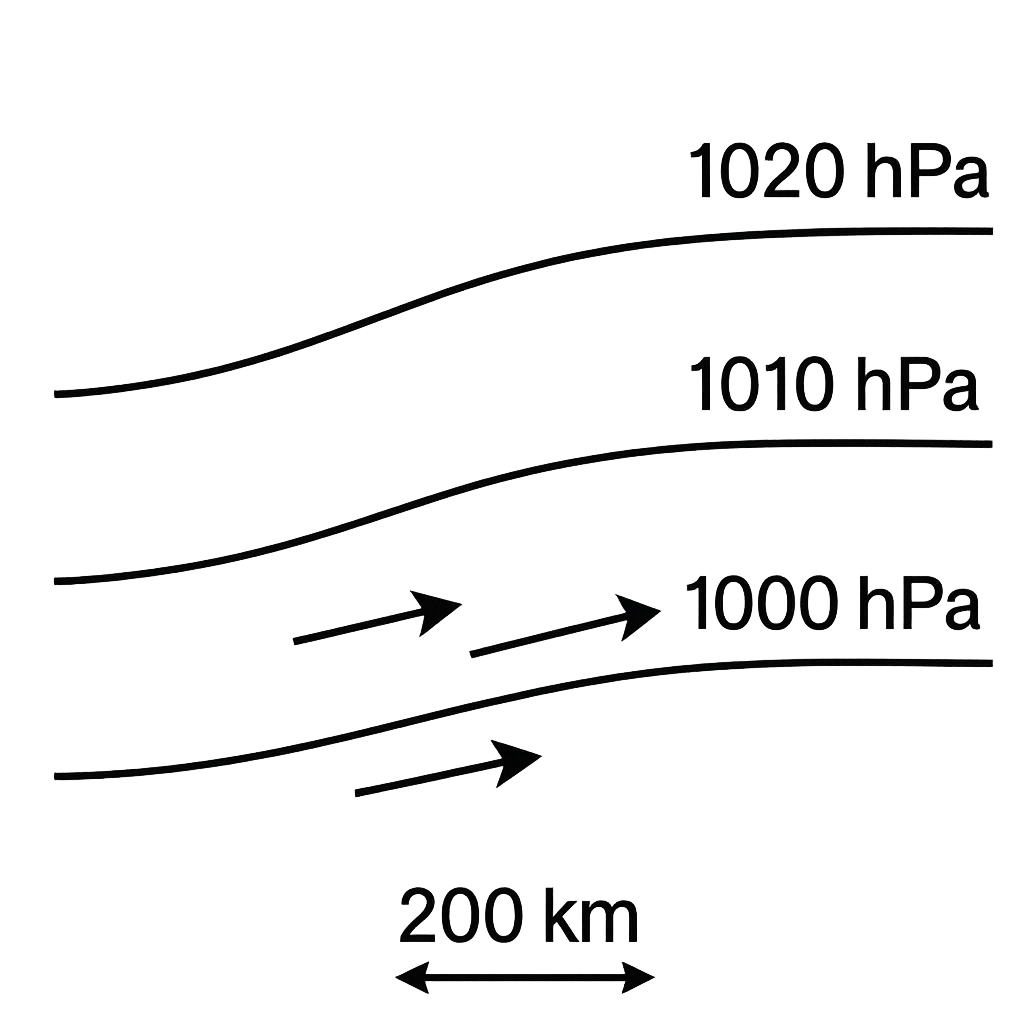
The diagram shows three isobars spaced 200 km apart with pressures of 1020 hPa, 1010 hPa and 1000 hPa. At the point between the 1010 hPa and 1000 hPa isobars, the pressure gradient is therefore 10 hPa over 200 km. Given a air density \(\rho = 1.2\,\text{kg·m}^{-3}\) and a Coriolis parameter \(f = 0.0001\,\text{s}^{-1}\), the geostrophic wind speed is calculated by \(V = \frac{1}{\rho f}\,\frac{\Delta P}{\Delta d}\), where \(\Delta P\) must be expressed in pascals and \(\Delta d\) in metres. Determine the wind speed in km/h at that point, rounded to the nearest kilometre per hour.
Correct A. 150
B. 200
C. 180
D. 120

Correct Answer: A

Want to see the full step-by-step solution? Unlock AI Explanation & Analytics
Question 15 View Details
A town lies at an altitude of 800 m. The mean sea‑level temperature is 28°C and the environmental lapse rate is 6.5°C per 1000 m. The town receives an annual precipitation of 1800 mm, which is evenly distributed throughout the year. Using the simplified Köppen criteria: if the average annual temperature is ≥ 24°C the climate is classified as tropical (type A); otherwise it is temperate (type C). The second letter is "f" when precipitation in the driest month is at least 60 mm (which is satisfied by the even distribution). Determine the Köppen climate classification code (first two letters) for the town.
A. Cw
B. Af
Correct C. Cf
D. Cs

Correct Answer: C

Want to see the full step-by-step solution? Unlock AI Explanation & Analytics
Question 16 View Details
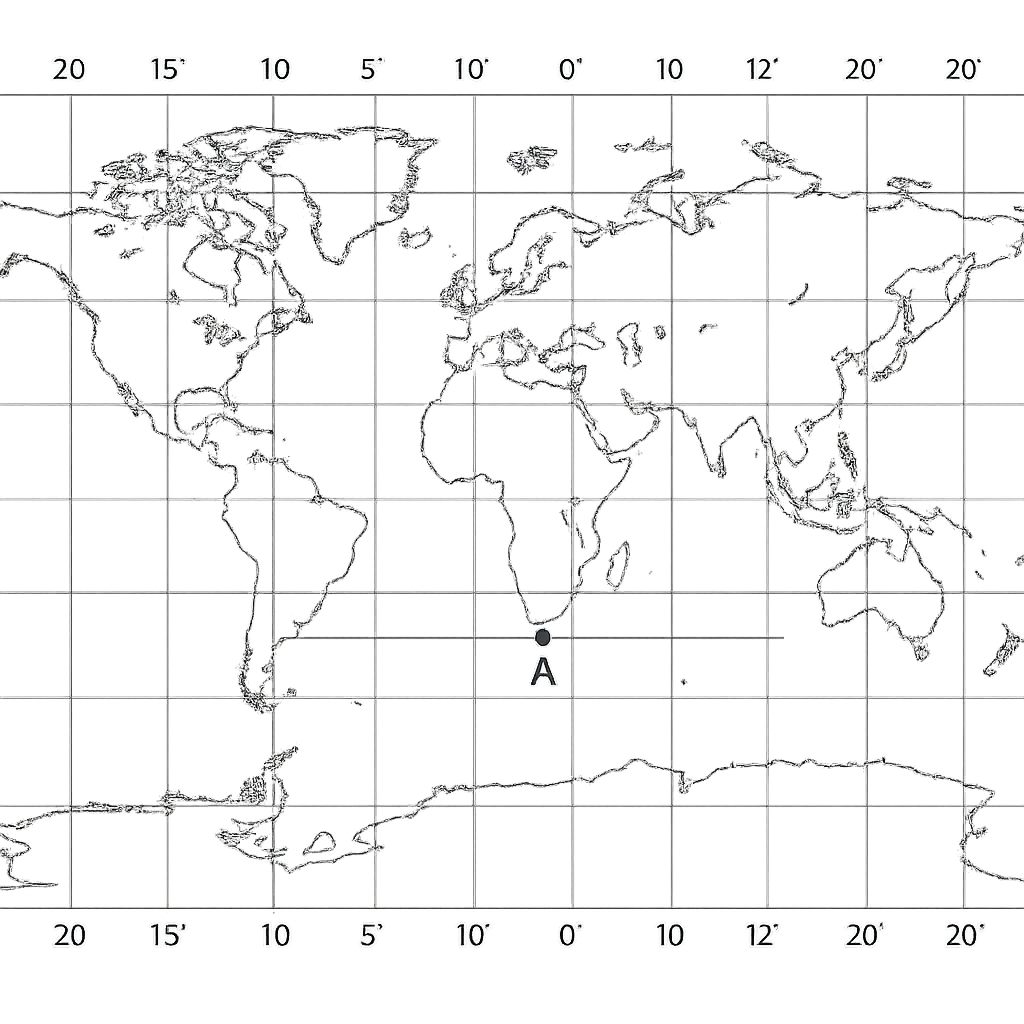
The map shows two towns, A and B. Town A is located at latitude \(5^{\circ}\text{N}\) and longitude \(7^{\circ}\text{E}\). Town B lies due east of Town A and its longitude is \(13^{\circ}\text{E}\). What is the latitude of Town B?
A. 6°N
Correct B. 5°N
C. 5°S
D. 4°N

Correct Answer: B

Want to see the full step-by-step solution? Unlock AI Explanation & Analytics
Question 17 View Details
A weather station recorded the maximum daily temperatures (in \(^{\circ}\)C) for a week as follows: 28, 30, 27, 32, 31, 29 and 33. The average of these seven values is \(A\). After a new day with a maximum temperature of \(35^{\circ}\)C, the average of the eight days becomes \(A+0.5\). Find the original average temperature \(A\).
Correct A. 31°C
B. 33°C
C. 32°C
D. 30°C

Correct Answer: A

Want to see the full step-by-step solution? Unlock AI Explanation & Analytics
Question 18 View Details
During a 14‑day period a town received a total rainfall of \(460\) mm. The first 7 days had an average rainfall of \(20\) mm per day. The next 5 days recorded a total of \(110\) mm. The remaining two days (days 13 and 14) are such that the rainfall on day 14 is twice that on day 13. Determine the amount of rainfall (in mm) on each of the last two days.
Correct A. Day 13: 70 mm, Day 14: 140 mm
B. Day 13: 60 mm, Day 14: 120 mm
C. Day 13: 80 mm, Day 14: 160 mm
D. Day 13: 65 mm, Day 14: 130 mm

Correct Answer: A

Want to see the full step-by-step solution? Unlock AI Explanation & Analytics
Question 19 View Details
A 250‑g sample of a sedimentary rock consists of 60 % quartz (density \(2.65\) g cm\(^{-3}\)), 30 % feldspar (density \(2.55\) g cm\(^{-3}\)) and 10 % mica (density \(2.80\) g cm\(^{-3}\)) by mass. Calculate the total volume of the rock sample in cubic centimetres, giving your answer to two decimal places.
A. 94.50 cm³
B. 95.12 cm³
Correct C. 94.94 cm³
D. 96.00 cm³

Correct Answer: C

Want to see the full step-by-step solution? Unlock AI Explanation & Analytics
Question 20 View Details
A farmer intends to cultivate maize on a 5‑hectare field. The expected base yield is 4 tonnes per hectare and the market price is \(\text{₦}120\) per kilogram. Two fertilizer regimes are available: *Regime A*: 100 kg of fertilizer per hectare at \(\text{₦}15{,}000\) per 100 kg, giving a 10 % increase in yield. *Regime B*: 150 kg of fertilizer per hectare at \(\text{₦}20{,}000\) per 150 kg, giving an 18 % increase in yield, but it also requires extra labour costing \(\text{₦}5{,}000\) per hectare. For each regime, compute the net profit per hectare and state which regime is more profitable. Show all steps of your calculation.
A. Regime B is more profitable; net profit per hectare = ₦541,400 (Regime A net profit = ₦500,000).
B. Regime B is more profitable; net profit per hectare = ₦530,000 (Regime A net profit = ₦513,000).
Correct C. Regime B is more profitable; net profit per hectare = ₦541,400 (Regime A net profit = ₦513,000).
D. Regime A is more profitable; net profit per hectare = ₦513,000 (Regime B net profit = ₦541,400).

Correct Answer: C

Want to see the full step-by-step solution? Unlock AI Explanation & Analytics
Question 21 View Details
Soil A contains \(45\%\) sand and \(35\%\) silt. Soil B contains \(40\%\) sand and its clay content is 1.5 times that of Soil A. Determine the silt percentage of Soil B and state the USDA textural class of Soil A and Soil B.
A. Soil B silt = 30%; Soil A: loam; Soil B: silty clay loam
B. Soil B silt = 28%; Soil A: loam; Soil B: silty clay
Correct C. Soil B silt = 30%; Soil A: loam; Soil B: clay loam
D. Soil B silt = 32%; Soil A: sandy loam; Soil B: clay loam

Correct Answer: C

Want to see the full step-by-step solution? Unlock AI Explanation & Analytics
Question 22 View Details
An engineering geotechnical investigation shows a compressible clay layer \(5\) m thick with an initial void ratio of \(0.9\) and a compression index \(C_c = 0.35\). The effective vertical stress at the middle of the layer before loading is \(100\) kPa. A new building imposes an additional uniform pressure of \(150\) kPa on the ground surface. Assuming one‑dimensional primary consolidation, calculate the total primary settlement of the clay layer (in metres, to two decimal places).
A. 0.33 m
B. 0.45 m
C. 0.25 m
Correct D. 0.37 m

Correct Answer: D

Want to see the full step-by-step solution? Unlock AI Explanation & Analytics
Question 23 View Details
A soil has a gravimetric water content at field capacity of \(0.20\) g g\(^{-1}\) and at wilting point of \(0.10\) g g\(^{-1}\). The bulk density of the soil is \(1.4\ \text{g cm}^{-3}\). If the effective root‑zone depth is \(0.60\) m, determine the amount of plant‑available water (PAW) in millimetres over the root zone per hectare.
Correct A. 84 mm
B. 96 mm
C. 70 mm
D. 112 mm

Correct Answer: A

Want to see the full step-by-step solution? Unlock AI Explanation & Analytics
Question 24 View Details
A map is drawn at a scale of 1 cm : 250 m. Two towns are 7.5 cm apart on the map. (a) State the representative fraction (RF) of the map. (b) Calculate the real distance between the towns in kilometres, correct to three decimal places.
A. RF 1:25000; distance 2.000 km
Correct B. RF 1:25000; distance 1.875 km
C. RF 1:25000; distance 1.500 km
D. RF 1:25000; distance 2.250 km

Correct Answer: B

Want to see the full step-by-step solution? Unlock AI Explanation & Analytics
Question 25 View Details
A topographic map has a contour interval of 20 m. Point A lies on the 140 m contour line and point B lies on the 200 m contour line. The straight‑line distance between A and B on the map is 3 cm and the map scale is 1 cm : 500 m. Determine the average slope between A and B expressed as a percentage (to the nearest whole number).
A. 6 %
Correct B. 4 %
C. 5 %
D. 3 %

Correct Answer: B

Want to see the full step-by-step solution? Unlock AI Explanation & Analytics

Master the Exam!

You've seen a preview, but there are thousands more questions plus AI tutor to break down complex solutions.

Unlock Full Access Available for Android & Windows
Help others prepare! Share this practice hub:
Chat with Support