neco model questions vol1 2019 geography | Essay

Prepare for your exams with neco model questions vol1 questions? Reviewing past/model questions is one of the most effective ways to guarantee a high score. This practice hub features authentic 2019 geography (Essay) questions designed to simulate the real exam environment.

Practice these randomly selected questions to test your readiness.
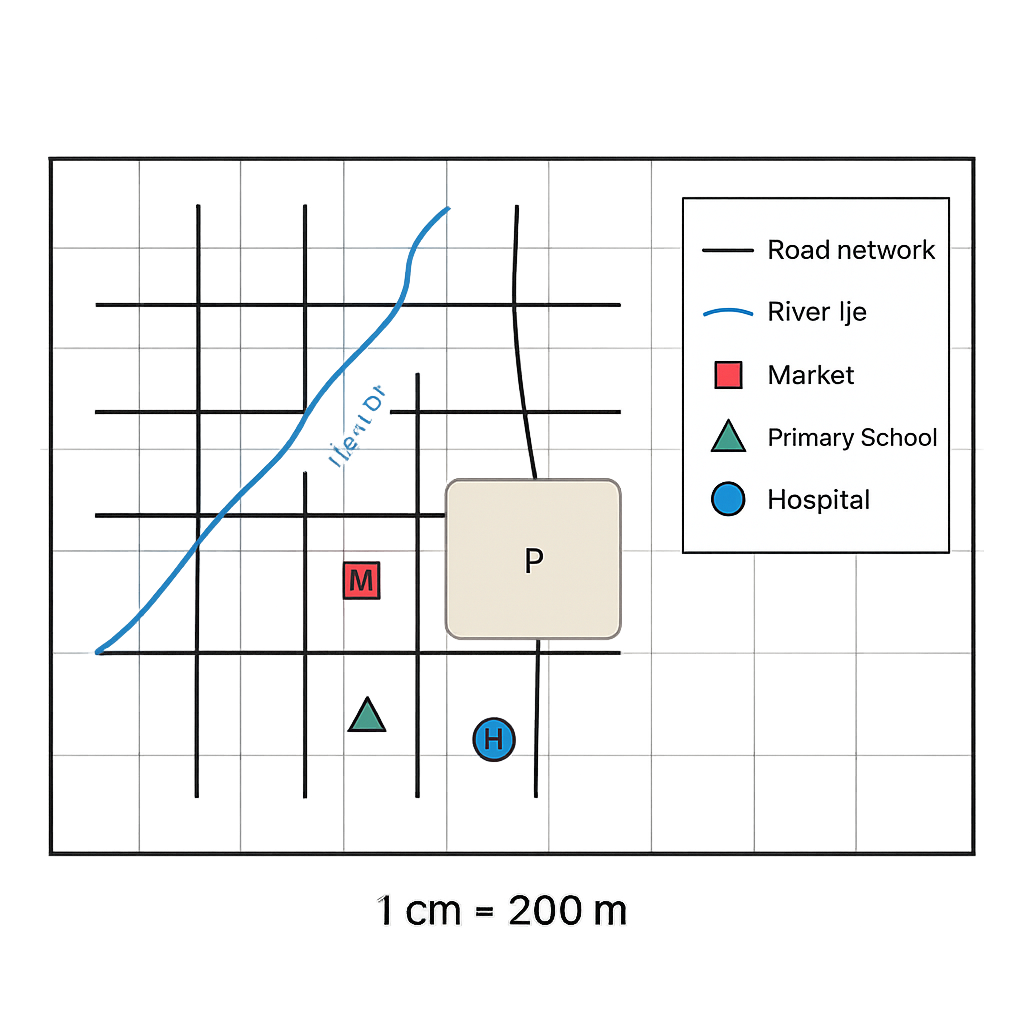
Question 1 View Details
The map below shows a section of the town of Oke-Idan. The map is drawn on a sheet of paper measuring 10 cm (east‑west) by 8 cm (north‑south). The scale bar on the map indicates that 1 cm on the map represents 200 metres on the ground. The map includes the following symbols: - A solid black line for roads. - A blue line for the River Ije. - A red square for the Market (labelled M). - A green triangle for the Primary School (labelled S). - A blue circle for the Hospital (labelled H). - A shaded area representing the Central Park (labelled P). The map is oriented with north at the top. Using the information on the map, answer the following questions:
Question Parts
(a)
State the true bearing of the line joining the Primary School (S) to the Hospital (H).
(b)
Calculate the actual ground distance between the Market (M) and the River Ije at the point nearest to the market.
(c)
The shaded Central Park (P) occupies an area of 12 grid squares on the map. Each grid square on the map measures 1 cm by 1 cm. Determine the actual area of the park in hectares (1 ha = 10,000 m²).
(d)
If a new map of the same area is to be drawn at a reduced scale of 1 cm = 500 m, what will be the length in centimetres of the road segment that currently measures 3.5 cm on the original map?
Detailed Essay Solution & Marking Scheme Available

Get the step-by-step mathematical proofs, key points required by examiners, and a comprehensive breakdown from our AI Tutor.

Question 2 View Details
The second map shown is a different representation of the same area as the first map. This map uses a scale of 1 cm = 500 m. The map measures 6 cm (east‑west) by 5 cm (north‑south). The map includes the same features as the first map (Roads, River Ije, Market M, Primary School S, Hospital H, Central Park P). The map also shows a new feature – a new residential estate (labelled R) located 2.5 cm east of the Primary School and 1.5 cm north of the Market. Answer the following questions:
Question Parts
(a)
Determine the real ground distance in kilometres between the Primary School (S) and the new residential estate (R).
(b)
If the Central Park (P) occupies 9 grid squares on this map (each square 1 cm × 1 cm), calculate the percentage increase or decrease in the reported area of the park compared with the area obtained from the first map.
(c)
A planning committee wishes to construct a straight road linking the Hospital (H) to the Market (M). Using the coordinates implied by the map (origin at the south‑west corner, x‑axis eastwards, y‑axis northwards), derive the equation of the line representing this road in the form y = mx + c, where x and y are in centimetres on the map.
(d)
Explain, in two to three sentences, why the area of Central Park appears smaller on the second map even though the real area has not changed.
Detailed Essay Solution & Marking Scheme Available

Get the step-by-step mathematical proofs, key points required by examiners, and a comprehensive breakdown from our AI Tutor.

Question 3 View Details
The table below gives the geographic coordinates of two Nigerian towns. | Town | Latitude (° N) | Longitude (° E) | |------|----------------|-----------------| | A | 7°30' | 5°30' | | B | 9°15' | 7°45' | Using this information, answer the following questions:
Question Parts
(a)
State which town lies farther north and justify using the coordinates.
(b)
Calculate the approximate north‑south distance between the two towns. (Assume 1° latitude ≈ 111 km and ignore the effect of longitude.)
(c)
If local solar time at Town A is 12:00 noon, estimate the local solar time at Town B at the same moment, assuming the Earth rotates 15° of longitude per hour.
(d)
Explain how the difference in latitude between the two towns is likely to affect their climatic characteristics.
Detailed Essay Solution & Marking Scheme Available

Get the step-by-step mathematical proofs, key points required by examiners, and a comprehensive breakdown from our AI Tutor.

Question 4 View Details
The table shows the weekly weather observations recorded at a coastal city. | Day | Max Temp (°C) | Min Temp (°C) | Relative Humidity (%) | Wind Speed (km/h) | |----------|---------------|---------------|-----------------------|-------------------| | Monday | 30 | 22 | 78 | 12 | | Tuesday | 32 | 23 | 82 | 10 | | Wednesday| 31 | 21 | 80 | 14 | | Thursday | 33 | 24 | 85 | 9 | | Friday | 34 | 25 | 88 | 8 | | Saturday | 35 | 26 | 90 | 7 | | Sunday | 33 | 24 | 84 | 11 | Answer the following questions:
Question Parts
(a)
Calculate the mean maximum temperature for the week.
(b)
Using the heat‑index approximation HI = T + 0.33·RH – 0.70·W (where T is the maximum temperature in °C, RH is relative humidity in %, and W is wind speed in km/h), identify the day with the highest heat index and compute its value (round to one decimal place).
(c)
Explain why the heat index on the identified day is higher than on other days that have similar maximum temperatures.
(d)
Discuss how the observed pattern of wind speed throughout the week could influence the perceived temperature and comfort level of the inhabitants.
Detailed Essay Solution & Marking Scheme Available

Get the step-by-step mathematical proofs, key points required by examiners, and a comprehensive breakdown from our AI Tutor.

Question 5 View Details
The table below shows the average monthly temperature (°C) and rainfall (mm) recorded at Town X over a year. | Month | Temp (°C) | Rainfall (mm) | |-------|----------|---------------| | Jan | 28 | 20 | | Feb | 30 | 25 | | Mar | 32 | 30 | | Apr | 34 | 40 | | May | 33 | 80 | | Jun | 31 | 150 | | Jul | 29 | 200 | | Aug | 28 | 180 | | Sep | 27 | 100 | | Oct | 26 | 50 | | Nov | 25 | 30 | | Dec | 27 | 20 | Using this information, answer the following questions:
Question Parts
(a)
Identify the Köppen climate classification of Town X and state the code.
(b)
Explain why Town X experiences a distinct dry season.
(c)
Calculate the annual mean temperature of Town X (to one decimal place).
(d)
Discuss two possible impacts of this tropical savanna climate on agricultural practices in the area.
Detailed Essay Solution & Marking Scheme Available

Get the step-by-step mathematical proofs, key points required by examiners, and a comprehensive breakdown from our AI Tutor.

Question 6 View Details
A field geologist has collected three rock specimens from different outcrops and recorded their observable properties as follows: - Sample A: Coarse‑grained, interlocking crystals of quartz and feldspar visible to the naked eye; no obvious layering. - Sample B: Fine‑grained, composed mainly of clay minerals, displays fissility and breaks into thin sheets. - Sample C: Medium‑grained, contains rounded fragments of older rocks set in a calcite matrix. Answer the questions that follow:
Question Parts
(a)
Identify each sample: (i) Sample A (ii) Sample B (iii) Sample C
(b)
State the typical environment of formation for each identified rock.
(c)
Recommend which sample would be most suitable for use as a building stone and justify your choice.
Detailed Essay Solution & Marking Scheme Available

Get the step-by-step mathematical proofs, key points required by examiners, and a comprehensive breakdown from our AI Tutor.

Question 7 View Details
Aso Rock in Abuja is a prominent residual hill formed from the weathering and erosion of Precambrian granitic rocks. Using this example, answer the following questions.
Question Parts
(a)
Explain the two main types of weathering that act on granitic rocks and give one specific process for each type.
(b)
Describe how the processes identified in (a) have contributed to the formation of Aso Rock as a residual hill.
(c)
Evaluate two ways in which human activities in the Abuja area have altered the natural processes that shape Aso Rock.
(d)
Suggest two practical measures that could be adopted to minimise adverse human impacts on the integrity of Aso Rock.
Detailed Essay Solution & Marking Scheme Available

Get the step-by-step mathematical proofs, key points required by examiners, and a comprehensive breakdown from our AI Tutor.

Question 8 View Details
A river in the middle belt of Nigeria has the following measured characteristics: total river length (following its course) = 150 km; straight‑line distance between source and mouth = 90 km; catchment area = 2 000 km²; mean annual rainfall = 1 500 mm; infiltration coefficient = 0.30 (i.e., 30 % of rainfall infiltrates). Using this information, answer the questions below.
Question Parts
(a)
Calculate the sinuosity of the river and state, to two decimal places, whether the river is straight, sinuous or meandering.
(b)
Determine the average annual runoff volume (in cubic metres) generated from the catchment and the corresponding average discharge (in cubic metres per second). Show all steps.
(c)
Discuss at least three natural factors that favour the development of meanders in this river.
(d)
Based on the calculated discharge and sinuosity, assess the flood risk for settlements located on the floodplain and recommend two engineering or land‑use measures to reduce that risk.
Detailed Essay Solution & Marking Scheme Available

Get the step-by-step mathematical proofs, key points required by examiners, and a comprehensive breakdown from our AI Tutor.

Master the Exam!

You've seen a preview, but there are thousands more questions plus AI tutor to break down complex solutions.

Unlock Full Access Available for Android & Windows
Help others prepare! Share this practice hub:
Chat with Support