neco model questions vol1 2018 geography | Essay

Prepare for your exams with neco model questions vol1 questions? Reviewing past/model questions is one of the most effective ways to guarantee a high score. This practice hub features authentic 2018 geography (Essay) questions designed to simulate the real exam environment.

Practice these randomly selected questions to test your readiness.
Question 1 View Details
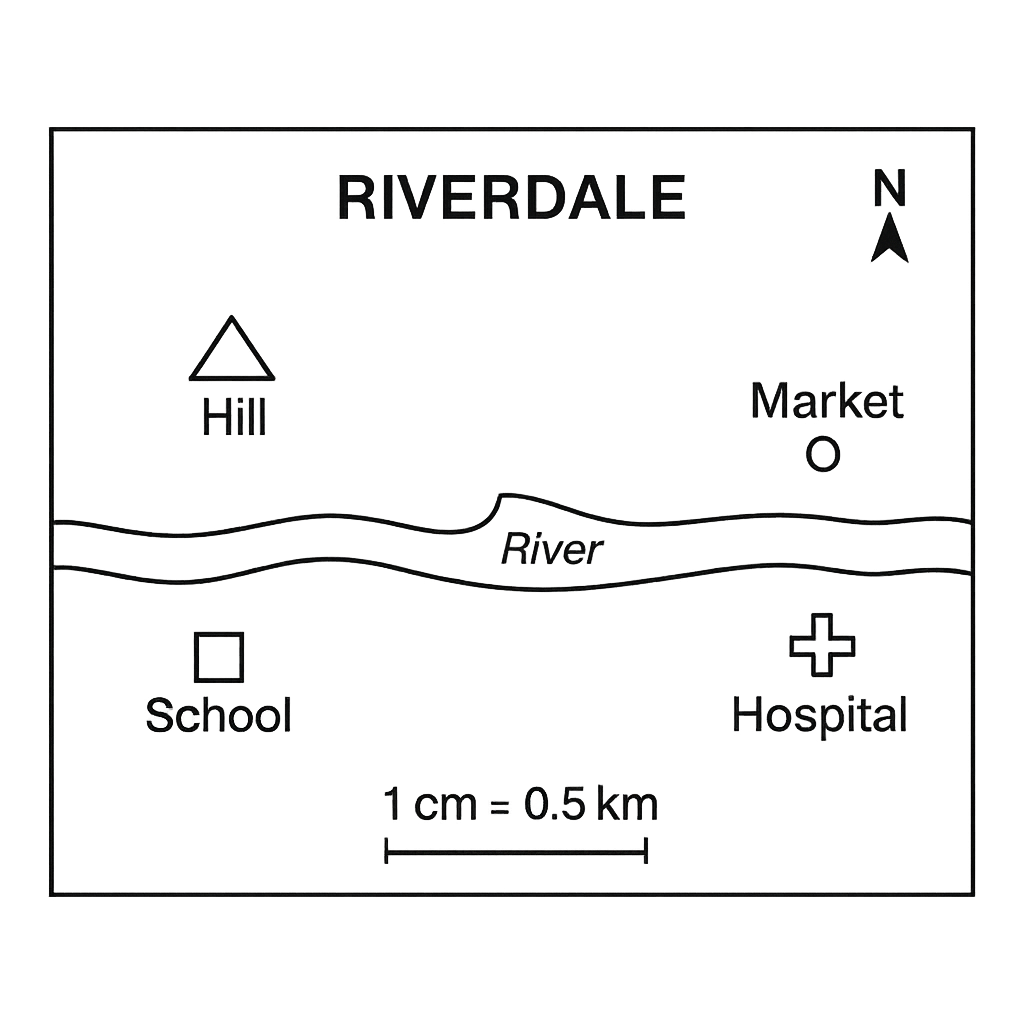
The map of Riverdale town is drawn with a scale of 1 cm = 0.5 km. The map shows a river flowing east‑west across the centre, a school, a market, a hospital and a hill (symbolised by a triangle). The north arrow points upwards.
Question Parts
(a)
If the distance between the school and the market on the map is 6 cm, state the true distance in kilometres.
(b)
Using the north arrow, indicate the direction from the hospital to the river.
(c)
A new road is to be built directly from the school to the hospital. Estimate its length in kilometres if the straight‑line distance on the map is 8 cm.
(d)
The hill is represented by a triangle symbol on the map. Explain two pieces of information that can be inferred about the hill from the map.
Detailed Essay Solution & Marking Scheme Available

Get the step-by-step mathematical proofs, key points required by examiners, and a comprehensive breakdown from our AI Tutor.
Question 2 View Details
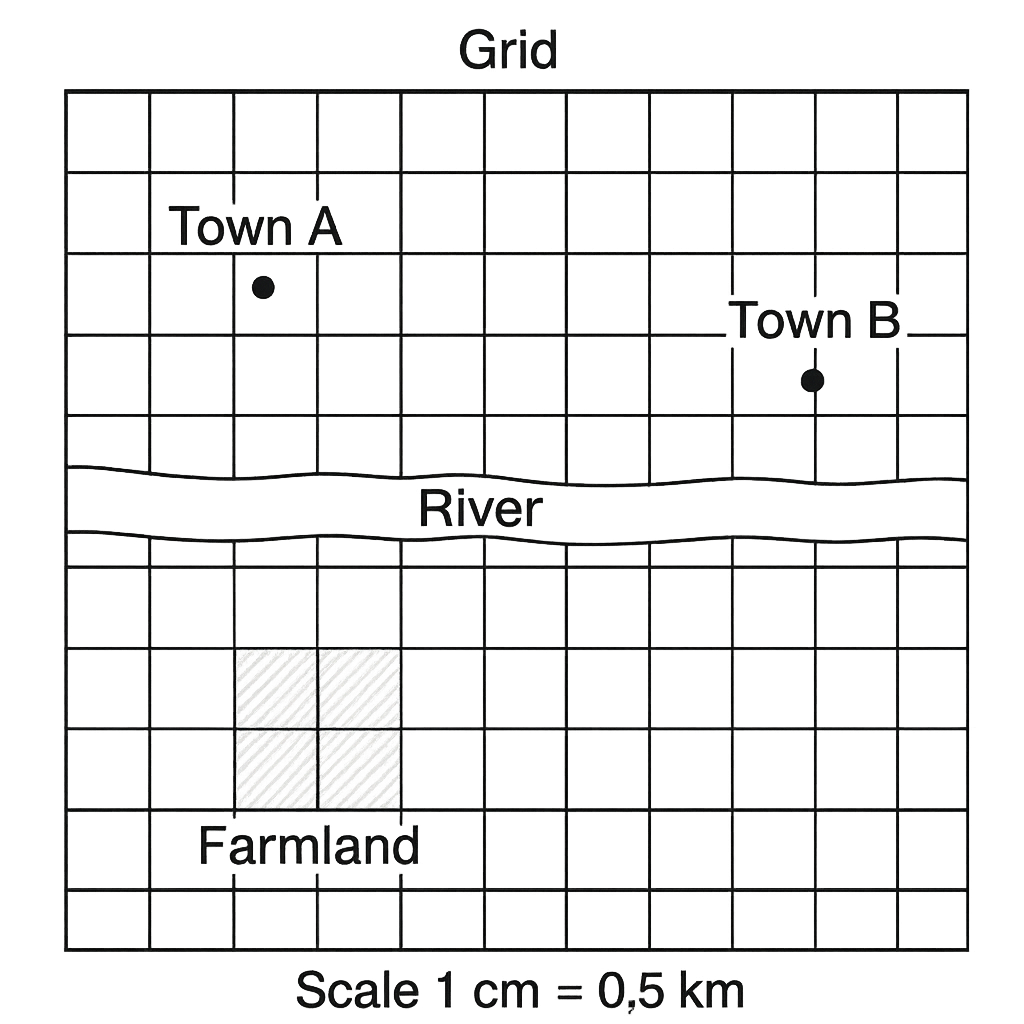
A topographic map of the district is drawn with a scale of 1 cm = 0.5 km. The map includes a grid where each square measures 2 cm on a side. The map shows Town A, Town B, a river, and a farmland plot covering three whole grid squares.
Question Parts
(a)
The distance between Town A and Town B on the map is 12.5 cm. State the true distance in kilometres.
(b)
Each grid square on the map represents a real‑world area. Determine the actual area (in km²) of the farmland plot that occupies three whole grid squares.
(c)
The river is shown to be 1.8 cm wide on the map. What is the actual width of the river in kilometres?
(d)
Discuss two advantages of using a scaled map for planning infrastructure projects in the district.
Detailed Essay Solution & Marking Scheme Available

Get the step-by-step mathematical proofs, key points required by examiners, and a comprehensive breakdown from our AI Tutor.

Question 3 View Details
The geographical coordinates of three Nigerian cities are given below: - Lagos: 6°27' N, 3°24' E - Kano: 12°00' N, 8°31' E - Port Harcourt: 4°48' N, 7°00' E Using these data, answer the following questions:
Question Parts
(a)
Convert the coordinates of each city from degrees‑minutes to decimal degrees (to two decimal places).
(b)
Estimate the straight‑line distance between Lagos and Kano. Use 1° latitude ≈ 111 km and 1° longitude ≈ 111 km × cos (latitude). Show all steps.
(c)
Explain why the distance obtained in part (b) is only an approximation and discuss two factors that could cause the actual road distance between Lagos and Kano to differ from this value.
Detailed Essay Solution & Marking Scheme Available

Get the step-by-step mathematical proofs, key points required by examiners, and a comprehensive breakdown from our AI Tutor.

Question 4 View Details
A synoptic chart for a region of Nigeria at 0900 GMT on 15 March shows the following data: - Isobars: 1018 hPa over Enugu, 1012 hPa over Abuja, 1005 hPa over Kano. - A cold front extending from 10° N, 8° E to 12° N, 10° E. - Surface wind observations: Enugu – wind from the east at 4 m s⁻¹; Abuja – wind from the northeast at 6 m s⁻¹; Kano – wind from the north at 8 m s⁻¹. - Temperatures: Enugu 26 °C, Abuja 24 °C, Kano 22 °C. - Relative humidities: Enugu 80 %, Abuja 70 %, Kano 60 %. Answer the following questions:
Question Parts
(a)
Identify the type of front shown on the chart and describe the typical weather conditions associated with this front in the northern hemisphere.
(b)
Assuming the straight‑line distance between Enugu and Abuja is 300 km, calculate the magnitude of the pressure‑gradient force (PGF) between the two stations. Use a standard air density of 1.2 kg m⁻³ and the relation PGF = –(1/ρ) ∂p/∂x. State the direction of the resulting wind (ignoring friction).
(c)
Discuss two reasons why the observed wind directions at Enugu, Abuja and Kano differ from the direction predicted solely by the pressure‑gradient calculated in part (b).
Detailed Essay Solution & Marking Scheme Available

Get the step-by-step mathematical proofs, key points required by examiners, and a comprehensive breakdown from our AI Tutor.

Question 5 View Details
The table below shows the average monthly temperature (°C) and total rainfall (mm) recorded at three Nigerian weather stations (A, B and C) over a 12‑month period. Station A – Temperature (°C): 28, 29, 30, 31, 32, 33, 33, 32, 31, 30, 29, 28 Station A – Rainfall (mm): 120, 110, 115, 130, 140, 150, 155, 150, 140, 130, 115, 110 Station B – Temperature (°C): 27, 28, 29, 30, 31, 32, 33, 33, 32, 31, 30, 28 Station B – Rainfall (mm): 20, 25, 30, 45, 80, 120, 150, 140, 100, 60, 30, 15 Station C – Temperature (°C): 22, 23, 24, 25, 26, 27, 27, 26, 25, 24, 23, 22 Station C – Rainfall (mm): 200, 190, 210, 220, 230, 240, 250, 240, 230, 220, 190, 200 Using the data above, answer the following questions:
Question Parts
(a)
Identify which station experiences a tropical savanna climate (Aw) according to the Köppen classification. Justify your choice with reference to the temperature and rainfall patterns.
(b)
For Station B, calculate the coefficient of variation (CV) of the annual rainfall and interpret what the value indicates about the reliability of rainfall for agricultural planning.
(c)
Discuss two possible impacts of the identified tropical savanna climate on agricultural practices in the region of Station B, and suggest one practical adaptation strategy to mitigate these impacts.
Detailed Essay Solution & Marking Scheme Available

Get the step-by-step mathematical proofs, key points required by examiners, and a comprehensive breakdown from our AI Tutor.

Question 6 View Details
A geologist collected three rock samples from different locations in Nigeria. The following observations were recorded for each sample: Sample X: coarse‑grained, interlocking crystals, hardness 7 on Mohs scale, reacts vigorously with dilute HCl, contains visible quartz grains. Sample Y: fine‑grained, layered, hardness 3, no reaction with HCl, contains abundant mica flakes. Sample Z: glassy, vesicular, hardness 5, no reaction with HCl, contains phenocrysts of feldspar. Using these observations, answer the questions below:
Question Parts
(a)
Identify the rock type (igneous, sedimentary or metamorphic) for each sample and justify your identification using the given observations.
Detailed Essay Solution & Marking Scheme Available

Get the step-by-step mathematical proofs, key points required by examiners, and a comprehensive breakdown from our AI Tutor.

Question 7 View Details
A region in northern Nigeria consists of a high plateau that has been extensively dissected by a network of valleys, forming a rugged terrain. The plateau has an average slope of about 5 %, receives an average annual rainfall of 1 200 mm, and is underlain by resistant Precambrian granite. The River Z cuts a deep gorge through the plateau and is being considered for the construction of a dam.
Question Parts
(a)
Explain the geomorphological processes that lead to the formation of a dissected plateau such as the one described.
(b)
Given the plateau’s average slope (5 %) and annual rainfall (1 200 mm), discuss the likely pattern of surface runoff and its implications for soil erosion on the plateau.
(c)
The River Z is being considered for a dam at the narrowest part of its gorge through the plateau. Evaluate the suitability of this site, taking into account geological and geomorphological factors, and give two recommendations to improve the dam’s long‑term safety.
Detailed Essay Solution & Marking Scheme Available

Get the step-by-step mathematical proofs, key points required by examiners, and a comprehensive breakdown from our AI Tutor.

Question 8 View Details
The River Y basin in the middle belt of Nigeria covers an area of 250 km². The basin receives a mean annual rainfall of 1 500 mm and loses 800 mm per year to evaporation. The infiltration coefficient for the basin is 0.30. Observations show that during the rainy season the river reaches a peak discharge of 120 m³ s⁻¹. For a design storm of 50 mm rainfall lasting 2 hours, the runoff coefficient is taken as 0.50 and the time of concentration for the basin is 1.5 hours.
Question Parts
(a)
Estimate the mean annual runoff volume (in cubic metres) generated from the basin.
(b)
Using the rational method, estimate the peak discharge (in m³ s⁻¹) for the design storm, assuming the rainfall intensity is uniformly distributed over the time of concentration.
Detailed Essay Solution & Marking Scheme Available

Get the step-by-step mathematical proofs, key points required by examiners, and a comprehensive breakdown from our AI Tutor.

Master the Exam!

You've seen a preview, but there are thousands more questions plus AI tutor to break down complex solutions.

Unlock Full Access Available for Android & Windows
Help others prepare! Share this practice hub:
Chat with Support