neco model questions vol1 2017 geography | Objective

Prepare for your exams with neco model questions vol1 questions? Reviewing past/model questions is one of the most effective ways to guarantee a high score. This practice hub features authentic 2017 geography (Objective) questions designed to simulate the real exam environment.

Practice these randomly selected questions to test your readiness.

Question 1 View Details
An urban catchment of \(2.5\ \text{km}^2\) has \(40\%\) impervious area with runoff coefficient \(0.9\) and \(60\%\) pervious area with coefficient \(0.3\). A design storm of \(80\ \text{mm h}^{-1}\) lasting 10 minutes is expected. The slope of the drainage conduit is \(0.001\) and the Manning roughness coefficient is \(n = 0.013\). Using the Rational method to find the peak discharge and then Manning's equation for a full circular pipe, determine the minimum internal diameter (in metres, to one decimal place) of the pipe required to convey the runoff.
A. 4.0
B. 2.8
C. 5.2
Correct D. 3.4

Correct Answer: D

Want to see the full step-by-step solution? Unlock AI Explanation & Analytics
Question 2 View Details
Monthly mean temperatures (°C) and rainfall (mm) for the first six months of a region are given:\n\nJan (31 days): \(T=24\), \(P=20\)\nFeb (28 days): \(T=25\), \(P=15\)\nMar (31 days): \(T=27\), \(P=10\)\nApr (30 days): \(T=28\), \(P=5\)\nMay (31 days): \(T=30\), \(P=2\)\nJun (30 days): \(T=31\), \(P=0\)\n\nThe monthly potential evapotranspiration (PET) can be estimated by\n\[\text{PET}=0.6\,T\,\frac{N}{30}\;(\text{mm})\]\nwhere \(N\) is the number of days in the month. For each month calculate the water‑deficit \(D = \text{PET} - P\) (if negative, treat as zero). Which month experiences the greatest water‑deficit, and what is its value (to one decimal place)?
A. May, 16.6
Correct B. June, 18.6
C. March, 6.7
D. April, 11.8

Correct Answer: B

Want to see the full step-by-step solution? Unlock AI Explanation & Analytics
Question 3 View Details
An existing settlement has a population of 12 000. The natural increase rate is 2.5 % per year and net migration adds 300 persons annually. The settlement occupies 8 km². The average household size is 5 persons and each new house requires a plot of \(0.0002\ \text{km}^2\).\n\n(a) Project the population after 10 years, assuming the growth and migration occur each year.\n(b) Estimate the number of households required at that time and the total land needed for housing.\n(c) Based on the projected population, will the settlement be re‑classified as a town (population ≥ 20 000) or remain a village? Provide the projected population, land needed (km², to two decimal places) and the classification.
A. Population 19012, land needed 0.80 km², town
Correct B. Population 18738, land needed 0.75 km², village
C. Population 18250, land needed 0.68 km², village
D. Population 17500, land needed 0.72 km², village

Correct Answer: B

Want to see the full step-by-step solution? Unlock AI Explanation & Analytics
Question 4 View Details
Two travel options connect City X to City Y, which are 120 km apart.\n\nOption A: Direct bus, average speed 60 km h⁻¹, fare = ₦0.5 per km + ₦20 base.\n\nOption B: Train from X to Z (80 km, speed 80 km h⁻¹, fare = ₦0.4 per km + ₦30 base) then bus from Z to Y (50 km, speed 50 km h⁻¹, same bus fare as Option A). A transfer waiting time of 15 min is incurred at Z.\n\nThe journey must be completed within 3 hours. Determine which option satisfies the time limit and yields the lower total cost. State the chosen option and its total cost (₦).
Correct A. Option A, 80
B. Option B, 78
C. Option B, 85
D. Option A, 90

Correct Answer: A

Want to see the full step-by-step solution? Unlock AI Explanation & Analytics
Question 5 View Details
A cement factory produces 500 tonnes per month. Fixed monthly cost = ₦2 000 000. Variable production cost = ₦150 000 per tonne. The market price is ₦250 000 per tonne. Transport cost is ₦5 per tonne per kilometre.\n\nTwo potential markets are considered:\n- Market A: 80 km away, no price discount.\n- Market B: 120 km away, offers a 5 % discount on the market price if sales exceed 400 tonnes.\n\nAssuming the entire monthly output is sold to a single market, calculate the monthly profit for each market and indicate which market is more profitable. Provide the profit figures (₦) and the preferred market.
Correct A. Market A, profit 47800000
B. Market B, profit 46000000
C. Market A, profit 45200000
D. Market B, profit 47800000

Correct Answer: A

Want to see the full step-by-step solution? Unlock AI Explanation & Analytics
Question 6 View Details
A proposed road reduces travel distance from \(45\) km to \(30\) km and increases average speed from \(40\) km/h to \(60\) km/h. Before construction, \(12{,}000\) vehicles used the original route each day. After construction, the total daily vehicle‑hours saved is \(1{,}800\). The value of time is \(\text{₦}1{,}500\) per hour and the construction cost is \(\text{₦}180\) million, amortised over \(10\) years. Is the project economically justified? Answer "Yes" if the net annual benefit is positive, otherwise answer "No".
A. Nope
B. Negative
Correct C. Yes
D. No

Correct Answer: C

Want to see the full step-by-step solution? Unlock AI Explanation & Analytics
Question 7 View Details
A 2 km² catchment is 60 % residential (runoff coefficient \(C=0.7\)) and 40 % open grass (\(C=0.3\)). Using a 10‑year storm of intensity \(i=80\) mm h⁻¹ for 30 min, determine the minimum diameter of a circular concrete culvert (Manning \(n=0.013\), slope \(S=0.001\), length 30 m) that can convey the peak discharge. Give the diameter in centimetres, rounded up to the nearest centimetre.
A. 400
B. 380
C. 350
Correct D. 365

Correct Answer: D

Want to see the full step-by-step solution? Unlock AI Explanation & Analytics
Question 8 View Details
Three zones (A, B, C) are assessed for landslide risk. Their areas, annual landslide probabilities and average economic loss per event are:\n\n- Zone A: 40 km², probability \(0.02\), loss \(\text{₦}1{,}500\) million\n- Zone B: 30 km², probability \(0.05\), loss \(\text{₦}800\) million\n- Zone C: 20 km², probability \(0.01\), loss \(\text{₦}2{,}000\) million\n\nThe regional risk index is defined as total expected annual loss divided by total area (Naira per km²). If the index exceeds \(\text{₦}800{,}000\) per km², the area is classified as "High" risk; otherwise "Low". Determine the risk classification.
A. Moderate
B. Very High
C. Low
Correct D. High

Correct Answer: D

Want to see the full step-by-step solution? Unlock AI Explanation & Analytics
Question 9 View Details
A district contains three towns. Their populations and areas are:\n\n- Town X: 45,000 people, 30 km²\n- Town Y: 30,000 people, 12 km²\n- Town Z: 20,000 people, 8 km²\n\nIdentify the town with the highest population density and state whether it satisfies the criteria for a "major town" (density > \(1{,}500\) persons/km² and population > \(35{,}000\)). Provide the town name followed by "Yes" or "No".
A. Town Z, Yes
Correct B. Town Y, No
C. Town X, No
D. Town X, Yes

Correct Answer: B

Want to see the full step-by-step solution? Unlock AI Explanation & Analytics
Question 10 View Details
A city had a population of \(1.2\) million in 2010. Its annual growth rate fell linearly from \(3\%\) in 2010 to \(1\%\) in 2020 and continues to decline at the same rate. Estimate the population in 2025, rounding to the nearest thousand.
A. 1470000
B. 1540000
Correct C. 1499000
D. 1522000

Correct Answer: C

Want to see the full step-by-step solution? Unlock AI Explanation & Analytics
Question 11 View Details
In a region the average annual rainfall is 1500 mm and the average slope is 8°. The rock hardness index is 3 for sandstone and 5 for granite. Using the erosion potential formula \(E = \frac{R \times S}{H}\), which rock type is more likely to develop a prominent cuesta?
Correct A. Sandstone
B. Granite
C. Limestone
D. Shale

Correct Answer: A

Want to see the full step-by-step solution? Unlock AI Explanation & Analytics
Question 12 View Details
The following data are for a location:\n\nMonthly average temperatures (°C): Jan 28, Feb 30, Mar 32, Apr 34, May 33, Jun 31, Jul 29, Aug 28, Sep 27, Oct 26, Nov 27, Dec 28.\nMonthly rainfall (mm): Jan 120, Feb 110, Mar 150, Apr 200, May 250, Jun 300, Jul 350, Aug 340, Sep 250, Oct 200, Nov 150, Dec 130.\nUsing the Köppen climate classification, determine the climate type of the location.
A. Aw (tropical savanna)
Correct B. Af (tropical rainforest)
C. Cfa (humid subtropical)
D. Am (tropical monsoon)

Correct Answer: B

Want to see the full step-by-step solution? Unlock AI Explanation & Analytics
Question 13 View Details
A region has an average daily high of 30°C, a low of 22°C and a relative humidity of 85%.\n(a) Calculate the dew‑point temperature (to one decimal place).\n(b) The region receives a total annual rainfall of 2100 mm, with a mean monthly rainfall of 175 mm. State whether the climate meets the Köppen criteria for a tropical rainforest climate.
Correct A. Dew‑point ≈ 23.3°C; Yes, it satisfies the tropical rainforest criteria
B. Dew‑point ≈ 24.8°C; Yes, it satisfies the tropical rainforest criteria
C. Dew‑point ≈ 23.3°C; No, it does not satisfy the tropical rainforest criteria
D. Dew‑point ≈ 20.5°C; Yes, it satisfies the tropical rainforest criteria

Correct Answer: A

Want to see the full step-by-step solution? Unlock AI Explanation & Analytics
Question 14 View Details
A manufacturing firm needs to locate a new plant. It will process 5 000 t of raw material per year and ship the same amount to market. Transport cost is ₦0.05 per ton‑km. The three possible sites have the following data:\n\nSite A: distance to raw material 80 km, distance to market 120 km, labour cost per worker ₦200 000 per year, 150 workers required, fixed capital cost ₦5 000 000, no agglomeration discount.\nSite B: distance to raw material 50 km, distance to market 150 km, labour cost per worker ₦180 000 per year, 130 workers required, fixed capital cost ₦4 500 000, 10 % agglomeration discount on total cost.\nSite C: distance to raw material 100 km, distance to market 80 km, labour cost per worker ₦210 000 per year, 160 workers required, fixed capital cost ₦5 200 000, no agglomeration discount.\nCalculate the total annual cost for each site (including transport, labour and capital, applying any discount) and identify the most economical location.
A. Site C
B. Site A and Site C (tie)
C. Site A
Correct D. Site B

Correct Answer: D

Want to see the full step-by-step solution? Unlock AI Explanation & Analytics
Question 15 View Details
A map is drawn at a scale of 1:50 000. If the distance between two towns on the map is 3.2 cm, what is the actual distance between the towns in kilometres?
Correct A. 1.6 km
B. 0.32 km
C. 3.2 km
D. 16 km

Correct Answer: A

Want to see the full step-by-step solution? Unlock AI Explanation & Analytics
Question 16 View Details
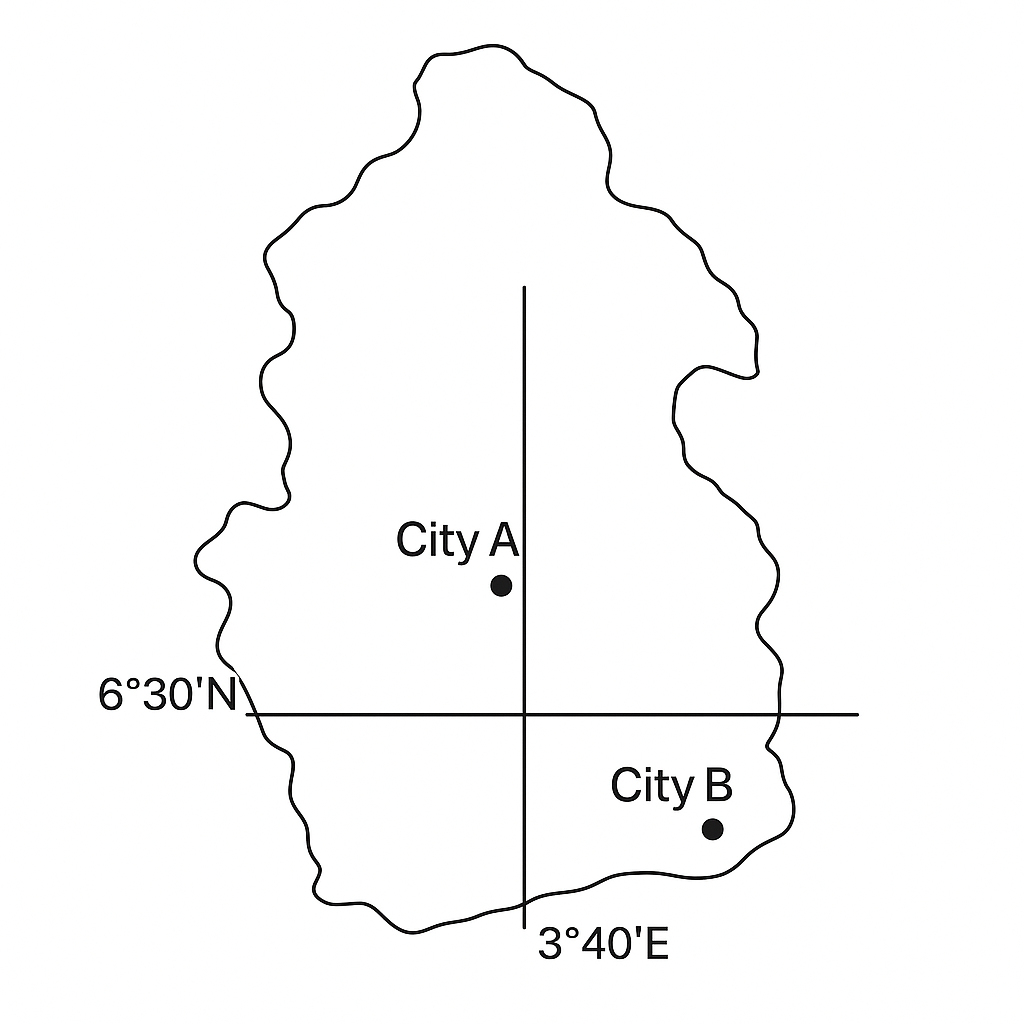
The map shows City A at latitude \(6^{\circ}30'\) N and City B at latitude \(7^{\circ}12'\) N. What is the difference in latitude between the two cities in degrees, and which city is farther north?
A. 0.8°; City B is farther north
B. 0.6°; City A is farther north
C. 0.7°; City A is farther north
Correct D. 0.7°; City B is farther north

Correct Answer: D

Want to see the full step-by-step solution? Unlock AI Explanation & Analytics
Question 17 View Details
A factory produces widgets. The total cost (in naira) is \(C = 5000 + 20L + 15K\), where \(L\) is the number of labour‑hours and \(K\) is the number of capital units. The revenue (in naira) is \(R = 50Q\), where output \(Q\) is given by the production function \(Q = 2\sqrt{L}\sqrt{K}\). If the factory uses \(K = 100\) capital units and aims for a profit of \(\text{₦}5{,}000\), determine the required labour‑hours \(L\). Then, if the labour cost per hour increases by 10 %, calculate the new profit (to the nearest naira).
A. Required labour‑hours ≈ 300 h; new profit ≈ ₦4,800
B. Required labour‑hours ≈ 280 h; new profit ≈ ₦4,200
C. Required labour‑hours ≈ 350 h; new profit ≈ ₦3,900
Correct D. Required labour‑hours ≈ 322 h; new profit ≈ ₦4,356

Correct Answer: D

Want to see the full step-by-step solution? Unlock AI Explanation & Analytics
Question 18 View Details
A map has a scale of 1 cm : 5 km. The distance between Town X and Town Y measured on the map is 7.2 cm. What is the actual distance between the towns in kilometres?
A. 40 km
Correct B. 36 km
C. 30 km
D. 35 km

Correct Answer: B

Want to see the full step-by-step solution? Unlock AI Explanation & Analytics
Question 19 View Details
The following table gives the average maximum and minimum temperatures (in °C) for six months in a city:\n\nMonth | \(T_{\text{max}}\) | \(T_{\text{min}}\)\n---|---|---\nJan | 30 | 22\nFeb | 32 | 23\nMar | 34 | 24\nApr | 33 | 25\nMay | 31 | 24\nJun | 29 | 23\n\nThe mean temperature for a month is \(T_{\text{mean}} = \frac{T_{\text{max}}+T_{\text{min}}}{2}\). Compute the overall mean annual temperature (average of the six monthly means) and state whether the climate is classified as "tropical" (mean ≥ 24 °C).
A. Overall mean = 26.5 °C; climate is tropical
Correct B. Overall mean = 27.5 °C; climate is tropical
C. Overall mean = 23.5 °C; climate is not tropical
D. Overall mean = 27.5 °C; climate is not tropical

Correct Answer: B

Want to see the full step-by-step solution? Unlock AI Explanation & Analytics
Question 20 View Details
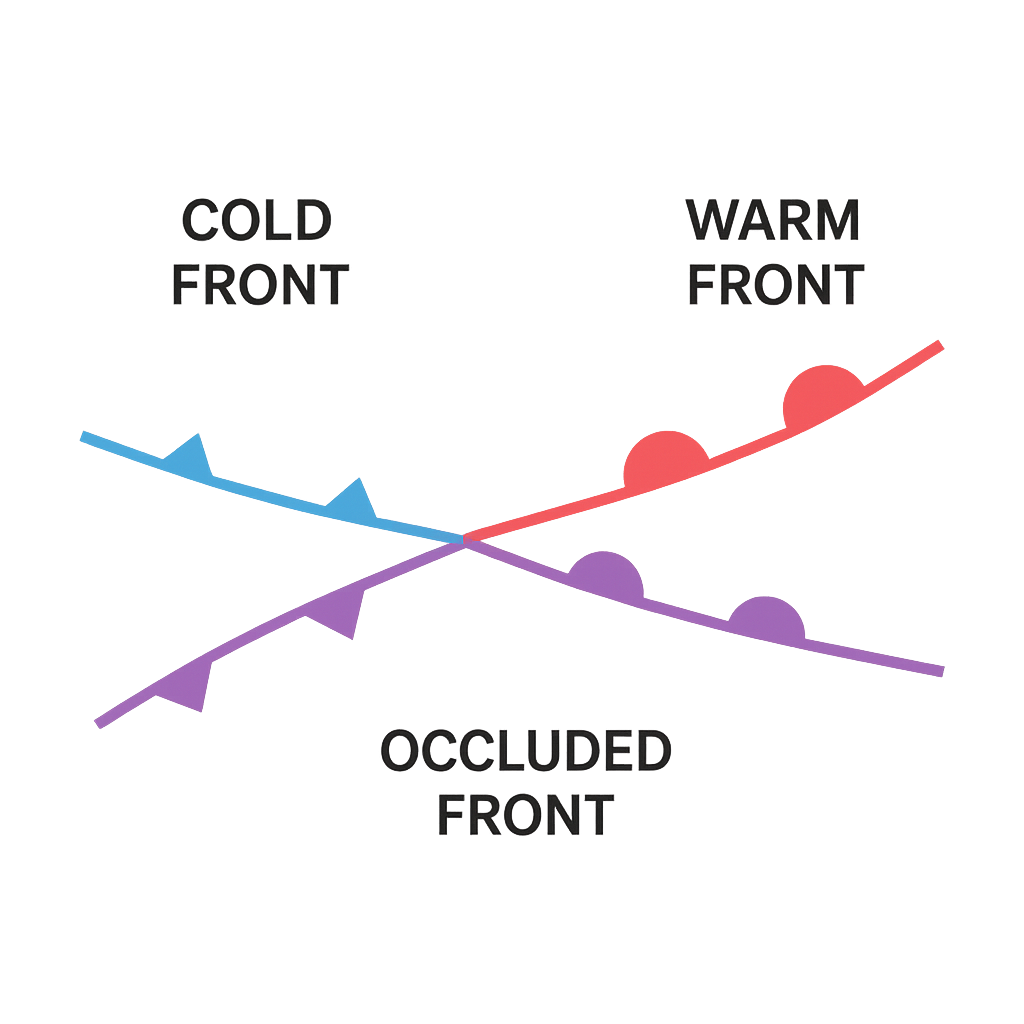
The diagram shows a cold front (blue triangles) advancing eastward and a warm front (red semicircles) moving northward, forming an occluded front at their intersection. Identify the type of front indicated by the blue triangles, describe the typical weather that follows its passage, and indicate the expected change in wind direction (from which cardinal direction to which) after the front passes.
A. Stationary front; intermittent clouds then mild weather; wind shifts from east to west
B. Warm front; steady rain then warm humid weather; wind shifts from southwest to northeast
Correct C. Cold front; rain‑showers then cooler clear weather; wind shifts from southeast to northwest
D. Occluded front; thunderstorms then cooler weather; wind shifts from north to south

Correct Answer: C

Want to see the full step-by-step solution? Unlock AI Explanation & Analytics
Question 21 View Details
A transport company operates two types of trucks. Type A can carry a maximum of \(10\) tonnes per trip and its fuel consumption is \(30\) L per 100 km when empty, increasing by \(0.5\) L per 100 km for each tonne carried. Type B can carry up to \(20\) tonnes per trip and consumes \(45\) L per 100 km when empty, increasing by \(0.4\) L per 100 km for each tonne carried. The company must move \(8\,000\) tonnes of goods each month over a round‑trip distance of \(150\) km. Assuming each truck always travels fully loaded (or as close as possible) and that the number of trips is unlimited, determine the minimum total volume of fuel (in litres) the company will use in a month.
A. 33 075 litres
Correct B. 31 800 litres
C. 42 000 litres
D. 32 250 litres

Correct Answer: B

Want to see the full step-by-step solution? Unlock AI Explanation & Analytics
Question 22 View Details
A 12‑ha field is composed of two soil types. Soil X occupies two‑thirds of the area and has an infiltration rate of \(12\) mm h⁻¹; Soil Y occupies the remaining one‑third and infiltrates at \(8\) mm h⁻¹. The field receives a uniform storm delivering \(120\) mm of rain over a period of \(6\) h. Assuming infiltration proceeds at the given constant rates during the storm and any excess water becomes runoff, calculate the total runoff volume from the field in cubic metres.
A. 7 680 m³
B. 7 200 m³
C. 5 760 m³
Correct D. 6 720 m³

Correct Answer: D

Want to see the full step-by-step solution? Unlock AI Explanation & Analytics
Question 23 View Details
State A and State B are being evaluated for classification as a "developed agricultural region". The criteria are: (i) aridity index greater than \(2.5\) and (ii) per‑capita GDP exceeding \(\,\text{₦}1{,}200{,}000\). The aridity index is defined as \(\dfrac{\text{annual rainfall (cm)}}{\text{mean annual temperature (°C)}+10}\). The data are: \n\n- State A: rainfall \(1{,}200\) mm, temperature \(28\)°C, population \(3{,}000{,}000\), GDP \(\,\text{₦}4{,}800{,}000{,}000\).\n- State B: rainfall \(800\) mm, temperature \(30\)°C, population \(2{,}500{,}000\), GDP \(\,\text{₦}3{,}200{,}000{,}000\).\n\nWhich state(s) satisfy both criteria?
A. State B only
Correct B. State A only
C. Both states
D. Neither state

Correct Answer: B

Want to see the full step-by-step solution? Unlock AI Explanation & Analytics
Question 24 View Details
A 5‑ha field has a soil pH of \(5.2\). The target pH is \(6.5\). To raise the pH, agricultural lime is applied. Each increase of \(0.1\) pH unit requires \(0.8\) tonnes of pure CaCO₃ per hectare. The lime available is 85 % CaCO₃ equivalent (CCE). How many tonnes of this lime should be spread over the whole field to reach the target pH?
Correct A. 61.2 tonnes (approximately)
B. 58.5 tonnes (approximately)
C. 64.0 tonnes (approximately)
D. 70.0 tonnes (approximately)

Correct Answer: A

Want to see the full step-by-step solution? Unlock AI Explanation & Analytics
Question 25 View Details
A farmer has a 10‑ha maize field and can choose between two fertilizer regimes.\n\nPlan 1: Apply \(120\) kg ha⁻¹ of a 20‑10‑10 NPK fertilizer (20 % N).\nPlan 2: Apply \(80\) kg ha⁻¹ of a 12‑24‑12 fertilizer (12 % N) together with \(30\) kg ha⁻¹ of urea (46 % N).\n\nThe expected increase in maize yield is \(0.025\) tonne per kilogram of nitrogen actually taken up by the crop. Urea loses 15 % of its nitrogen to volatilisation before uptake. Which plan will give the larger expected yield increase, and by how many tonnes per hectare?
A. Plan 1; about 0.04 t ha⁻¹ lower
Correct B. Plan 1; about 0.07 t ha⁻¹ higher
C. Plan 2; about 0.07 t ha⁻¹ lower
D. Plan 2; about 0.05 t ha⁻¹ higher

Correct Answer: B

Want to see the full step-by-step solution? Unlock AI Explanation & Analytics

Master the Exam!

You've seen a preview, but there are thousands more questions plus AI tutor to break down complex solutions.

Unlock Full Access Available for Android & Windows
Help others prepare! Share this practice hub:
Chat with Support