neco 2020 geography | Objective

Prepare for your exams with neco questions? Reviewing past/model questions is one of the most effective ways to guarantee a high score. This practice hub features authentic 2020 geography (Objective) questions designed to simulate the real exam environment.

Practice these randomly selected questions to test your readiness.

Question 1 View Details
A country is divided into three vegetation zones defined as follows: Rainforest - annual rainfall > 2000 mm and mean temperature > 24\(^\circ\)C; Savanna - rainfall between 800 mm and 1500 mm and temperature between 20\(^\circ\)C and 28\(^\circ\)C; Grassland - rainfall < 800 mm and temperature between 15\(^\circ\)C and 25\(^\circ\)C. A region receives \(1200\) mm of rain and has a mean temperature of \(26\)\(^\circ\)C. Identify the vegetation zone of the region and calculate what percentage of the country's total land area it occupies if the region covers 3\,500 km\(^2\) and the country's total area is 250\,000 km\(^2\).
A. Rainforest; 1.4\%
Correct B. Savanna; 1.4\%
C. Grassland; 1.4\%
D. Savanna; 1.2\%

Correct Answer: B

Want to see the full step-by-step solution? Unlock AI Explanation & Analytics
Question 2 View Details
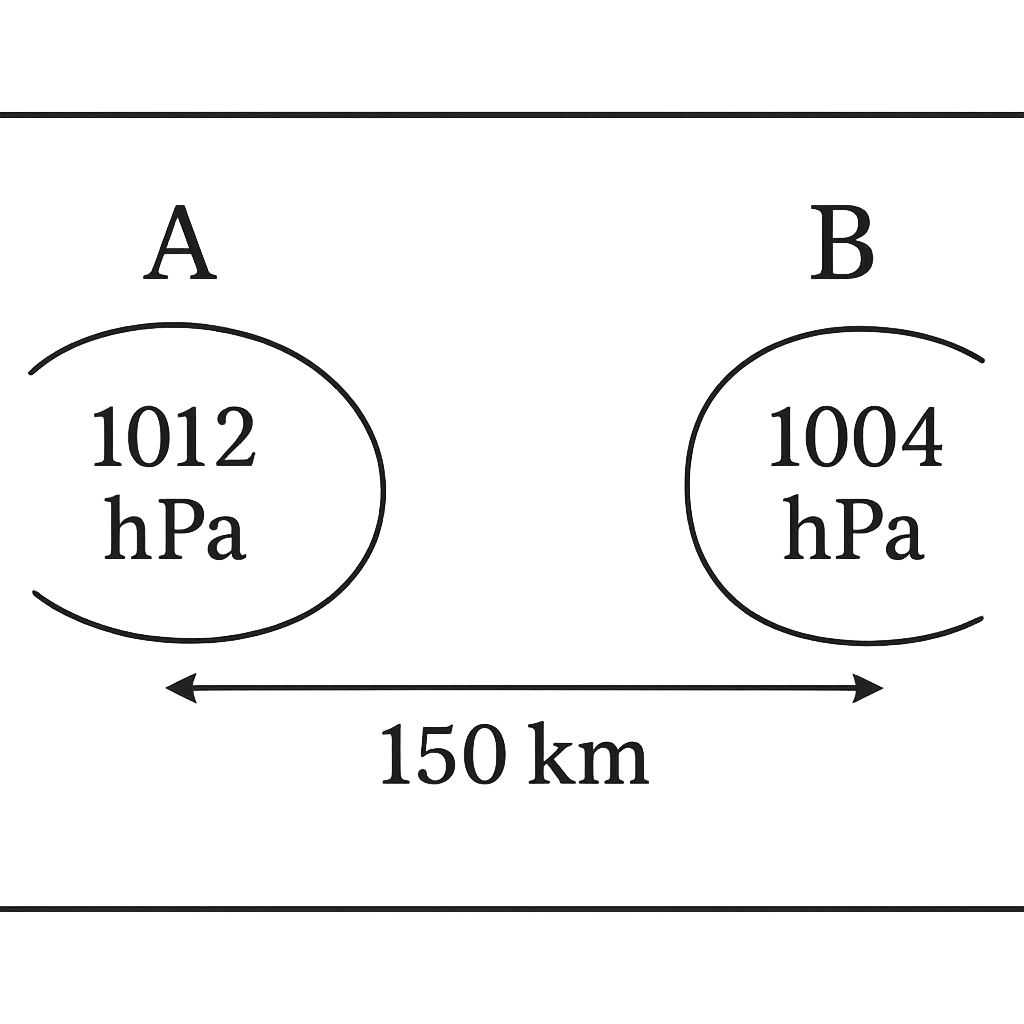
A weather map shows two stations, A and B, 150 km apart along an east‑west line. Station A (west) records a pressure of 1012 hPa, while station B (east) records 1004 hPa. Assuming the region lies in the Northern Hemisphere and that the wind is in geostrophic balance, state the approximate direction of the wind at the midpoint between the stations.
A. Westward (approximately due west)
Correct B. Southward (approximately due south)
C. Eastward (approximately due east)
D. Northward (approximately due north)

Correct Answer: B

Want to see the full step-by-step solution? Unlock AI Explanation & Analytics
Question 3 View Details
In 2010 a town had a population of 45\,000. The annual natural increase rate was 2.5\% and the net migration rate was -0.5\% per year. (a) Estimate the population in 2020 using compound growth. (b) Classify the settlement in 2020 as a town (population < 100\,000), a city (100\,000 \le population < 500\,000) or a metropolis (population \ge 500\,000). (c) Assuming the same net growth rate continues, in which year will the settlement first be re‑classified as a city? Give the number of years from 2020.
A. Population in 2020 ≈ 54,855; classification: town; about 25 years later (≈ year 2045) to become a city
Correct B. Population in 2020 ≈ 54,855; classification: town; about 31 years later (≈ year 2051) to become a city
C. Population in 2020 ≈ 57,300; classification: town; about 35 years later (≈ year 2055) to become a city
D. Population in 2020 ≈ 52,000; classification: town; about 28 years later (≈ year 2048) to become a city

Correct Answer: B

Want to see the full step-by-step solution? Unlock AI Explanation & Analytics
Question 4 View Details
A river has cut a V‑shaped valley to a present depth of 150 m. The average vertical erosion rate measured from dated terraces is 0.5 mm yr\(^{-1}\). (a) Assuming the erosion rate has been constant, estimate how many years ago the river began incising the valley. (b) If the region is undergoing a uniform tectonic uplift of 0.1 mm yr\(^{-1}\), what is the net deepening rate and the revised estimate of the incising time?
A. Without uplift: 250,000 years; with uplift: 300,000 years
B. Without uplift: 200,000 years; with uplift: 400,000 years
C. Without uplift: 300,000 years; with uplift: 250,000 years
Correct D. Without uplift: 300,000 years; with uplift: 375,000 years

Correct Answer: D

Want to see the full step-by-step solution? Unlock AI Explanation & Analytics
Question 5 View Details
The age‑structure of a country's population is as follows: 0-14 years = 30\% of the total, 15-64 years = 60\% and 65 years + = 10\%. (a) Compute the total dependency ratio (young + old dependents per 100 working‑age persons). (b) Compute the old‑age dependency ratio (old dependents per 100 working‑age persons). Express your answers to one decimal place.
A. Total dependency ratio ≈ 55.5; old‑age dependency ratio ≈ 12.5
Correct B. Total dependency ratio ≈ 66.7; old‑age dependency ratio ≈ 16.7
C. Total dependency ratio ≈ 60.0; old‑age dependency ratio ≈ 15.0
D. Total dependency ratio ≈ 75.0; old‑age dependency ratio ≈ 20.0

Correct Answer: B

Want to see the full step-by-step solution? Unlock AI Explanation & Analytics
Question 6 View Details
The average monthly rainfall (in mm) for a town for January to June are 120, 85, 95, 110, 130 and 100 respectively. The total annual rainfall recorded for the year is 1500 mm. Assuming that the rainfall for each of the months July to December is the same, determine (i) the rainfall for each of those six months (rounded to one decimal place) and (ii) the percentage of the total annual rainfall contributed by the months July to December (rounded to one decimal place). Let \(R_J\) denote the common rainfall for July-December.
A. Monthly rainfall = 140.0 mm; Percentage contribution = 56.0 %
Correct B. Monthly rainfall = 143.3 mm; Percentage contribution = 57.3 %
C. Monthly rainfall = 138.5 mm; Percentage contribution = 55.4 %
D. Monthly rainfall = 150.0 mm; Percentage contribution = 60.0 %

Correct Answer: B

Want to see the full step-by-step solution? Unlock AI Explanation & Analytics
Question 7 View Details
The output \(Q\) (units) of a factory is modelled by the Cobb‑Douglas function \(Q = 5L^{0.6}K^{0.4}\), where \(L\) is the number of labour‑hours employed and \(K\) is the number of capital units. Initially \(L = 200\) and \(K = 50\).\n\n(a) Management increases labour by 20 % while keeping capital unchanged. Calculate the percentage increase in output.\n\n(b) The factory now wishes to achieve a total output increase of 30 % relative to the original output, while keeping the labour at its new level. What percentage increase in capital is required? Give your answer to one decimal place.
A. Output increase ≈ 13.2 %; Capital must increase by ≈ 42.0 %
B. Output increase ≈ 9.6 %; Capital must increase by ≈ 55.2 %
Correct C. Output increase ≈ 11.4 %; Capital must increase by ≈ 47.4 %
D. Output increase ≈ 11.4 %; Capital must increase by ≈ 40.0 %

Correct Answer: C

Want to see the full step-by-step solution? Unlock AI Explanation & Analytics
Question 8 View Details
The following table gives the average monthly temperature (°C) of a region:\n\nJan - 2, Feb 2, Mar 10, Apr 18, May 24, Jun 28, Jul 30, Aug 29, Sep 22, Oct 14, Nov 6, Dec 0.\n\nThe region receives an annual precipitation of 800 mm, of which 70 % falls during the three summer months (June-August). Using the Köppen climate classification, determine the appropriate climate type for the region (choose from Cfa, Cfb, Dfa, Dfb).
A. Dfb
B. Dfa
Correct C. Cfa
D. Cfb

Correct Answer: C

Want to see the full step-by-step solution? Unlock AI Explanation & Analytics
Question 9 View Details
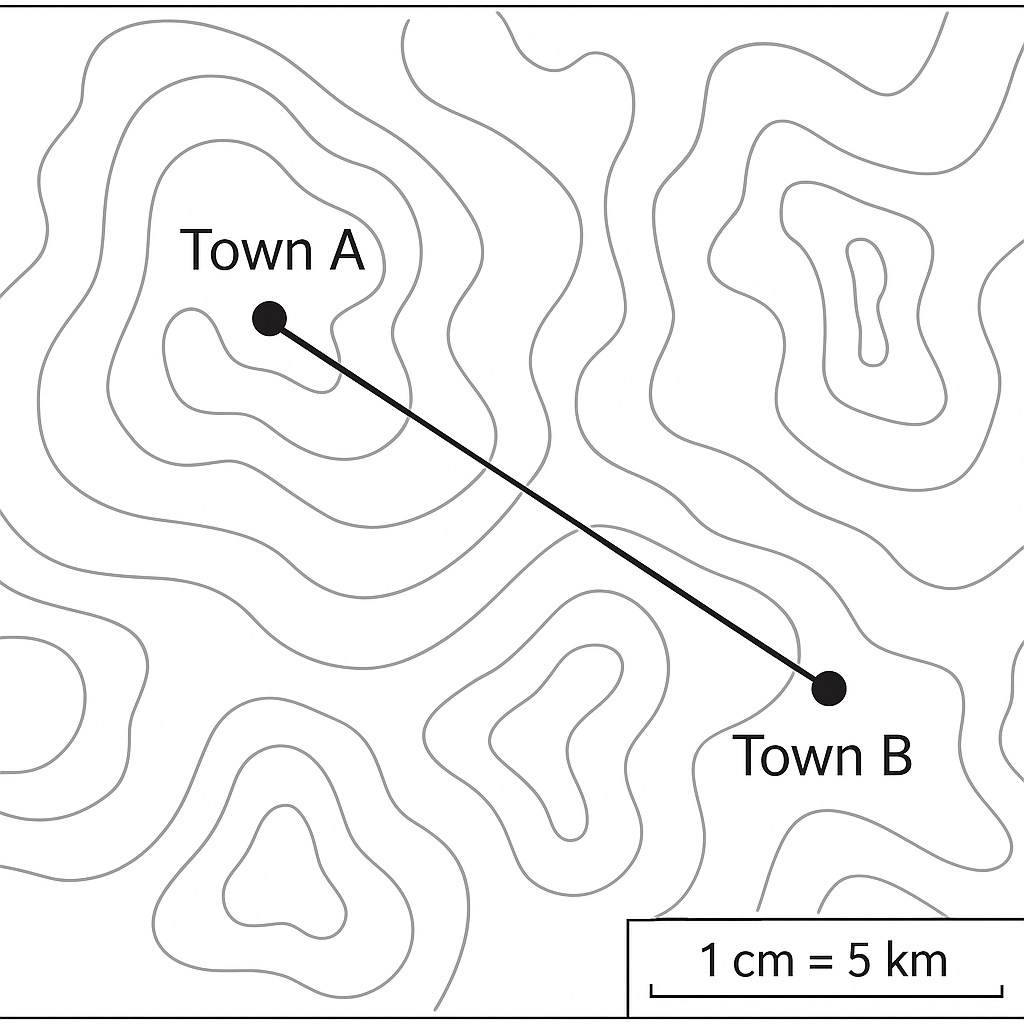
A topographic map shows the towns A and B separated by a measured distance of 7.2 cm. The map scale is 1 cm : 5 km. Calculate the real ground distance between the towns in kilometres.
A. 30 km
Correct B. 36 km
C. 72 km
D. 42 km

Correct Answer: B

Want to see the full step-by-step solution? Unlock AI Explanation & Analytics
Question 10 View Details
River X is 120 km long and drops 240 m in elevation from source to mouth.\n\n(a) Calculate the average gradient of the river in metres per kilometre.\n\n(b) At a certain cross‑section the discharge is measured as 150 m³ s⁻¹ and the cross‑sectional area is 75 m². Determine the average flow velocity (in m s⁻¹). State whether this velocity exceeds the critical velocity of 1.5 m s⁻¹ and briefly explain what this implies for the river's erosion potential.
A. Gradient = 2 m\/km; Velocity = 1 m\/s (does not exceed critical velocity, indicating low erosion potential)
B. Gradient = 1.5 m\/km; Velocity = 2.5 m\/s (exceeds critical velocity, indicating high erosion potential)
C. Gradient = 2 m\/km; Velocity = 1.8 m\/s (exceeds critical velocity, indicating moderate erosion potential)
Correct D. Gradient = 2 m/km; Velocity = 2 m/s (exceeds critical velocity, indicating high erosion potential)

Correct Answer: D

Want to see the full step-by-step solution? Unlock AI Explanation & Analytics
Question 11 View Details
An agriculturalist rotates three crops over a three‑year cycle: maize, soybean and wheat. The average nutrient removal per hectare for each crop is: - Maize: 120 kg N, 40 kg P₂O₅, 30 kg K₂O - Soybean: 60 kg N is fixed from the atmosphere, so the net removal is 30 kg N; it also removes 20 kg P₂O₅ and 15 kg K₂O - Wheat: 80 kg N, 35 kg P₂O₅, 25 kg K₂O Each year the farmer applies \(150\) kg ha\(^{-1}\) of a mixed fertilizer that contains \(15\)% N, \(10\)% P₂O₅ and \(12\)% K₂O. Over the three‑year cycle the farmer wants the net soil nitrogen balance to be zero (i.e., total nitrogen removal equals total nitrogen added). Determine the amount of pure nitrogen fertilizer (100 % N) that must be applied in the maize year to achieve this balance. Also compute the total cost if the mixed fertilizer costs \(\text{₦}400\) per kg and the pure nitrogen fertilizer costs \(\text{₦}900\) per kg.
A. Pure nitrogen required: 175 kg; Total cost: ₦342,500
Correct B. Pure nitrogen required: 162.5 kg; Total cost: ₦326,250
C. Pure nitrogen required: 150 kg; Total cost: ₦315,000
D. Pure nitrogen required: 162.5 kg; Total cost: ₦330,000

Correct Answer: B

Want to see the full step-by-step solution? Unlock AI Explanation & Analytics
Question 12 View Details
Monthly average temperatures (in \(^{\circ}\)C) and total annual rainfall (in mm) for three states are given below. State A: Temperatures - 24, 25, 26, 27, 28, 29, 30, 30, 29, 27, 25, 24; Rainfall - 1800 mm; Altitude - 350 m. State B: Temperatures - 22, 22, 23, 24, 25, 26, 27, 27, 26, 24, 23, 22; Rainfall - 1400 mm; Altitude - 500 m. State C: Temperatures - 20, 21, 22, 23, 24, 25, 26, 26, 25, 23, 22, 21; Rainfall - 1600 mm; Altitude - 800 m. For optimal cocoa production the climate must satisfy: (i) annual rainfall \(\ge\) 1500 mm, (ii) mean annual temperature between \(21^{\circ}\)C and \(27^{\circ}\)C inclusive, and (iii) altitude \(\le\) 600 m. Which state meets all three criteria?
A. State C
Correct B. State A
C. State B
D. State D

Correct Answer: B

Want to see the full step-by-step solution? Unlock AI Explanation & Analytics
Question 13 View Details
On a topographic map the contour interval is 20 m. Point P has a spot elevation of 340 m. Point Q lies 500 m east of P and is positioned exactly halfway between the 360 m and 380 m contour lines. Determine the gradient of the line PQ in degrees (to one decimal place) and state whether the slope is gentle, moderate or steep, using the classification: gentle < 5°, moderate 5°-15°, steep > 15°.
A. Gradient = 5.2° (moderate)
B. Gradient = 2.1° (gentle)
Correct C. Gradient = 3.4° (gentle)
D. Gradient = 16.0° (steep)

Correct Answer: C

Want to see the full step-by-step solution? Unlock AI Explanation & Analytics
Question 14 View Details
A catchment of 2 km² consists of 40 % forest (runoff coefficient C = 0.15), 30 % agricultural land (C = 0.30) and 30 % urban area (C = 0.70). A design storm has an intensity of 50 mm h⁻¹ lasting 1 hour. Using the Rational Method \(Q = C i A\) (where \(i\) is in m s⁻¹ and \(A\) in m²), calculate the peak discharge \(Q\) in m³ s⁻¹. Show all unit conversions.
Correct A. Peak discharge ≈ 10.0 m³ s⁻¹
B. Peak discharge ≈ 12.3 m³ s⁻¹
C. Peak discharge ≈ 9.0 m³ s⁻¹
D. Peak discharge ≈ 8.5 m³ s⁻¹

Correct Answer: A

Want to see the full step-by-step solution? Unlock AI Explanation & Analytics
Question 15 View Details
A region is exposed to three environmental hazards with the following probability of occurrence in a 10‑year period (\(P\)) and potential economic loss (\(L\)) in million Naira: - Flood: \(P = 0.3\), \(L = 120\) - Landslide: \(P = 0.1\), \(L = 250\) - Drought: \(P = 0.4\), \(L = 80\) The risk rating is \(R = P \times L\). The government can spend a mitigation budget \(B\) (million Naira) to reduce the probability of each hazard by a factor \((1 - 0.05 B_i)\), where \(B_i\) is the amount allocated to that hazard, but the probability cannot be reduced by more than 50 % of its original value. The total available budget is 10 million Naira (\(\sum B_i = 10\)). Determine the allocation \((B_{\text{flood}}, B_{\text{landslide}}, B_{\text{drought}})\) that minimizes the total risk after mitigation, and give the resulting total risk (in million Naira). Round each allocation to one decimal place.
Correct A. Allocation (million Naira): Flood = 10.0, Landslide = 0.0, Drought = 0.0; Total risk = 75
B. Allocation (million Naira): Flood = 0.0, Landslide = 0.0, Drought = 10.0; Total risk = 77
C. Allocation (million Naira): Flood = 0.0, Landslide = 10.0, Drought = 0.0; Total risk = 80.5
D. Allocation (million Naira): Flood = 5.0, Landslide = 0.0, Drought = 5.0; Total risk = 76

Correct Answer: A

Want to see the full step-by-step solution? Unlock AI Explanation & Analytics
Question 16 View Details
A town had a population of 5 million in the year 2000. From 2000 to 2004 the annual growth rate was \(2.5\%\). From 2005 onward the rate fell to \(1.8\%\) per year. In which year will the population first exceed 7 million? Give the calendar year.
A. 2015
Correct B. 2017
C. 2020
D. 2018

Correct Answer: B

Want to see the full step-by-step solution? Unlock AI Explanation & Analytics
Question 17 View Details
The table below shows the average monthly rainfall (mm) and average temperature (°C) for City X. Month | Rainfall (mm) | Temperature (°C) Jan | 120 | 28 Feb | 80 | 29 Mar | 150 | 30 Apr | 200 | 31 May | 250 | 32 Jun | 300 | 33 Jul | 350 | 34 Aug | 320 | 34 Sep | 210 | 33 Oct | 180 | 31 Nov | 130 | 30 Dec | 100 | 29 (a) Compute the annual average temperature (to one decimal place). (b) Which month has the greatest value of the ratio \(\frac{\text{rainfall}}{\text{temperature}}\)? State the month.
Correct A. 31.2; July
B. 31.2; June
C. 30.9; June
D. 31.5; August

Correct Answer: A

Want to see the full step-by-step solution? Unlock AI Explanation & Analytics
Question 18 View Details
A river falls from an elevation of 800 m at its source to 200 m at its mouth, covering a straight‑line distance of 120 km. (a) Calculate the average gradient of the river in metres per kilometre. (b) A particular 30 km stretch of the river drops 180 m. Determine its gradient and state whether this stretch is likely to contain rapids, given that a gradient greater than 5 m/km usually produces rapids.
A. 4 m\/km; No
Correct B. 5 m/km; Yes
C. 6 m\/km; No
D. 5 m\/km; No

Correct Answer: B

Want to see the full step-by-step solution? Unlock AI Explanation & Analytics
Question 19 View Details
A metamorphic rock sample is foliated, consists mainly of mica and quartz, and formed under a pressure of 5 kbar and a temperature of 450\(^{\circ}\)C. (a) Express the pressure in pascals. (b) Identify the most likely rock type.
A. Slate
Correct B. Schist
C. Phyllite
D. Gneiss

Correct Answer: B

Want to see the full step-by-step solution? Unlock AI Explanation & Analytics
Question 20 View Details
A truck consumes fuel according to the relation \(C = a + bL\) litres per kilometre, where \(L\) is the load in tonnes, \(a = 0.2\) L/km and \(b = 0.05\) L/km per tonne. The truck must travel a round‑trip of 150 km carrying a load of 8 t. Fuel costs \(\text{₦}200\) per litre.\n(a) Calculate the total fuel cost for the trip.\n(b) The company wishes to cut the fuel cost by 15 % by reducing the load by \(x\) tonnes. Find the value of \(x\) (to one decimal place).
A. 1.5
B. 2.1
C. 2.0
Correct D. 1.8

Correct Answer: D

Want to see the full step-by-step solution? Unlock AI Explanation & Analytics
Question 21 View Details
A map has a scale of 1 cm : 10 km. The distance between Town X and Town Y on the map is 3.5 cm. If a traveler can cover 40 km per hour, how many minutes will it take to travel from X to Y?
A. 35
B. 70
C. 60
Correct D. 52.5

Correct Answer: D

Want to see the full step-by-step solution? Unlock AI Explanation & Analytics
Question 22 View Details
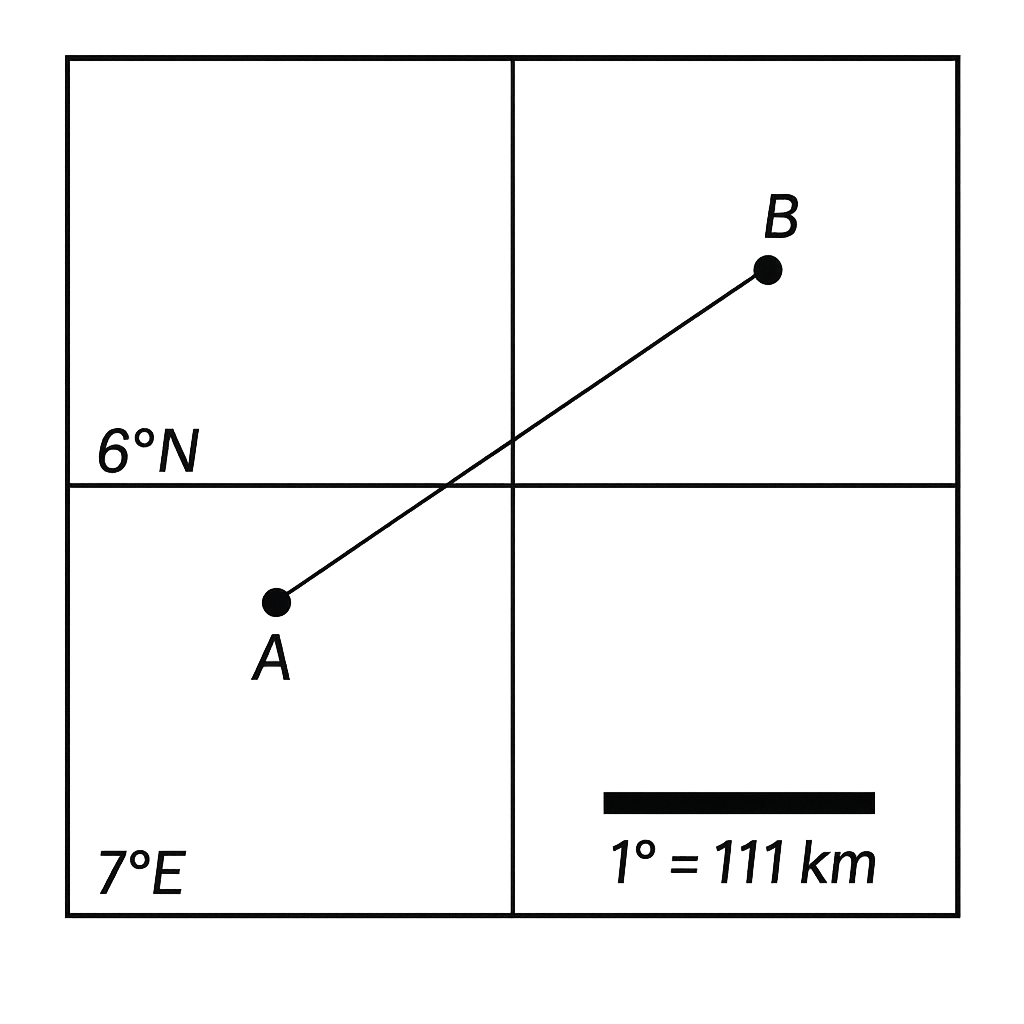
On the map, point A is at latitude 5°N, longitude 7°E and point B is at latitude 6°N, longitude 8°E. Assuming 1° of latitude equals 111 km and, for this exercise, 1° of longitude also equals 111 km, calculate the straight‑line distance between A and B in kilometres (round to the nearest kilometre).
A. 158
B. 111
C. 170
Correct D. 157

Correct Answer: D

Want to see the full step-by-step solution? Unlock AI Explanation & Analytics
Question 23 View Details
A soil profile consists of three horizons each 30 cm thick. Horizon A has a bulk density of 1.3 g·cm⁻³ and a field capacity of 24% (by weight). Horizon B has a bulk density of 1.4 g·cm⁻³ and a field capacity of 18%. Horizon C has a bulk density of 1.5 g·cm⁻³ and a field capacity of 12%. Assuming the soil is initially dry, calculate the amount of water (in millimetres) that can be retained in each horizon after a rainfall that fully wets the profile to field capacity. Which horizon retains the greatest amount of water?
A. Horizon A: 54.0 mm; Horizon B: 75.6 mm; Horizon C: 93.6 mm; Horizon C retains the most water.
Correct B. Horizon A: 93.6 mm; Horizon B: 75.6 mm; Horizon C: 54.0 mm; Horizon A retains the most water.
C. Horizon A: 93.6 mm; Horizon B: 75.6 mm; Horizon C: 54.0 mm; Horizon B retains the most water.
D. Horizon A: 90.0 mm; Horizon B: 78.0 mm; Horizon C: 55.0 mm; Horizon B retains the most water.

Correct Answer: B

Want to see the full step-by-step solution? Unlock AI Explanation & Analytics
Question 24 View Details
A soil sample has a pH of 5.5. Lime raises the pH by 0.5 units for every 2 tonnes per hectare applied. What amount of lime (in tonnes per hectare) is required to raise the pH to the lower limit of the optimal range for phosphorus availability (6.5)? After liming, will iron toxicity still be a concern (iron toxicity occurs below pH 5.0)?
A. 4 tonnes per hectare; Yes, iron toxicity will still be a concern.
B. 6 tonnes per hectare; No, iron toxicity will not be a concern.
C. 2 tonnes per hectare; No, iron toxicity will not be a concern.
Correct D. 4 tonnes per hectare; No, iron toxicity will not be a concern.

Correct Answer: D

Want to see the full step-by-step solution? Unlock AI Explanation & Analytics
Question 25 View Details
A region receives an average annual rainfall of 1200 mm and a mean annual temperature of 22°C. According to the Nigerian vegetation classification, which major vegetation type is most likely to occur in this region? Provide a brief justification based on the given climatic data.
A. Desert (arid) vegetation
Correct B. Savanna (tropical savanna) vegetation
C. Montane (highland) vegetation
D. Rainforest (tropical rainforest) vegetation

Correct Answer: B

Want to see the full step-by-step solution? Unlock AI Explanation & Analytics

Master the Exam!

You've seen a preview, but there are thousands more questions plus AI tutor to break down complex solutions.

Unlock Full Access Available for Android & Windows
Help others prepare! Share this practice hub:
Chat with Support