neco 2019 geography | Objective

Prepare for your exams with neco questions? Reviewing past/model questions is one of the most effective ways to guarantee a high score. This practice hub features authentic 2019 geography (Objective) questions designed to simulate the real exam environment.

Practice these randomly selected questions to test your readiness.

Question 1 View Details
An original shale contains \(70\%\) clay minerals, \(20\%\) quartz and \(10\%\) organic matter by weight. During regional metamorphism all organic matter is lost and \(5\%\) of the remaining mass is lost uniformly due to devolatilisation. The remaining clay minerals are completely transformed into mica while quartz remains unchanged. What is the weight percent of mica in the resulting metamorphic rock (to one decimal place)?
A. 70.0
B. 73.7
Correct C. 77.8
D. 66.5

Correct Answer: C

Want to see the full step-by-step solution? Unlock AI Explanation & Analytics
Question 2 View Details
Region A has an average annual rainfall of \(720\) mm, a mean temperature of \(27^{\circ}\)C, a total land area of \(150{,}000\) km\(^2\), a population of \(30\) million and \(12\%\) of its land is under irrigation. Region B receives \(540\) mm of rainfall, a mean temperature of \(24^{\circ}\)C, a land area of \(200{,}000\) km\(^2\), a population of \(45\) million and \(25\%\) of its land is under irrigation. Maize requires rainfall between \(500\) mm and \(800\) mm, an optimal temperature range of \(22^{\circ}\)C to \(28^{\circ}\)C and, if rainfall is below \(600\) mm, irrigation must supply at least \(100\) mm of additional water (each \(1\%\) of land under irrigation contributes \(4\) mm of water). Which region is more suitable for sustainable maize production? Justify your answer.
Correct A. Region A
B. Region B
C. Both regions
D. Neither region

Correct Answer: A

Want to see the full step-by-step solution? Unlock AI Explanation & Analytics
Question 3 View Details
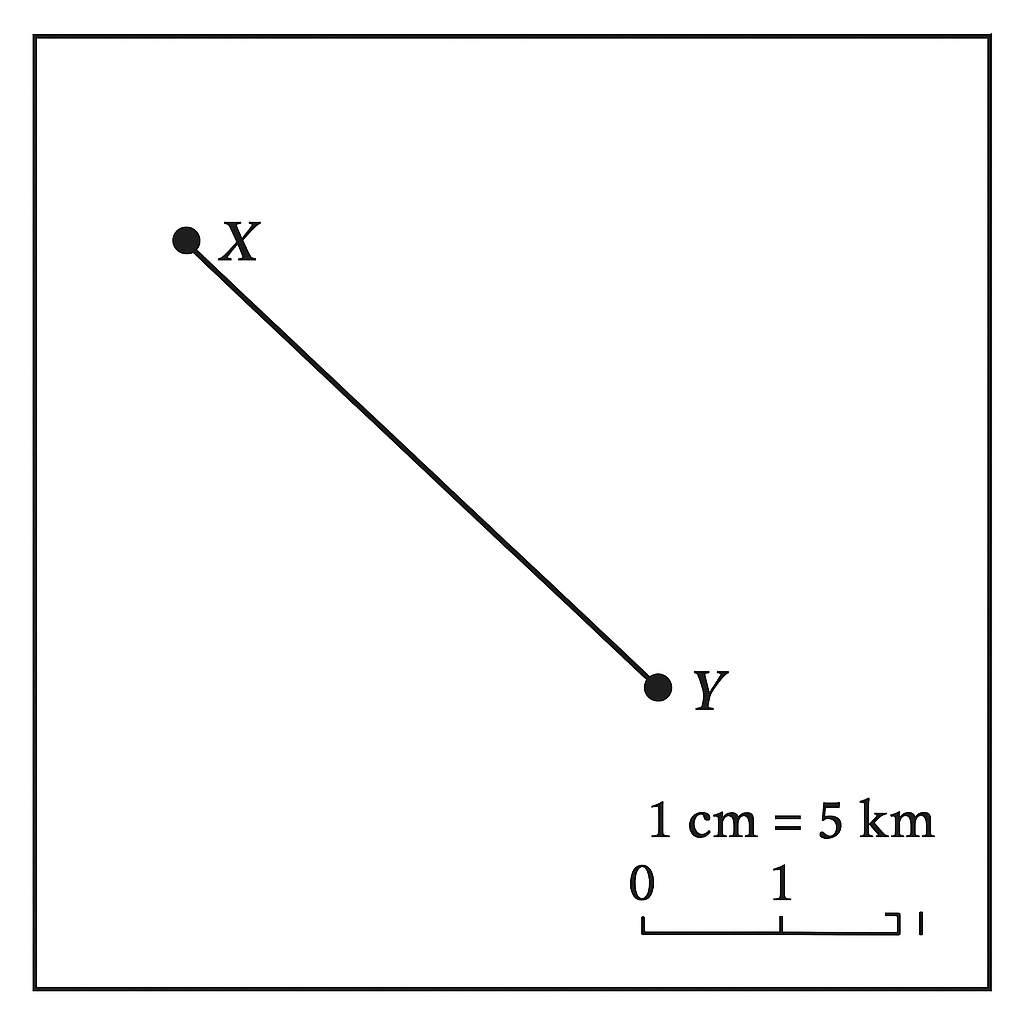
The map shows a scale of \(1\) cm : \(5\) km. The distance between Town X and Town Y measured on the map is \(7.2\) cm. What is the actual distance between the two towns in kilometres?
Correct A. 36
B. 30
C. 42
D. 40

Correct Answer: A

Want to see the full step-by-step solution? Unlock AI Explanation & Analytics
Question 4 View Details
City X is located at \(6^{\circ}\)N, \(7^{\circ}\)E and City Y at \(9^{\circ}\)N, \(12^{\circ}\)E. Assuming the Earth's radius is large enough that 1° of latitude equals \(111\) km and 1° of longitude equals \(111\) km \(\times\) \(\cos\phi\) where \(\phi\) is the latitude, estimate the straight‑line distance between the two cities in kilometres (round to the nearest kilometre).
A. 720
B. 800
C. 555
Correct D. 643

Correct Answer: D

Want to see the full step-by-step solution? Unlock AI Explanation & Analytics
Question 5 View Details
The average monthly temperatures (°C) for a location are: 28, 29, 30, 31, 32, 33, 33, 32, 31, 30, 29, 28. The average monthly rainfalls (mm) are: 5, 8, 12, 20, 45, 80, 120, 110, 70, 30, 10, 6. Using the Köppen climate classification, which climate type does this location belong to? (Choose from Af, Am, Aw).
A. Af
Correct B. Aw
C. Am
D. Cw

Correct Answer: B

Want to see the full step-by-step solution? Unlock AI Explanation & Analytics
Question 6 View Details
If \(30^{\circ}\text{C}\) is the sea‑level temperature and the environmental lapse rate is \(6.5^{\circ}\text{C}\) per 1,000 m, a survey records the region's temperature as \(27^{\circ}\text{C}\). (a) Determine the altitude of the region (in metres). The vegetation type is classified according to annual rainfall: tropical moist forest if rainfall is between 1,500 mm and 2,000 mm, savanna if rainfall is between 500 mm and 1,500 mm, and desert if rainfall is less than 250 mm. The region receives an average annual rainfall of 1,760 mm. (b) State the current vegetation type. Due to climate change the temperature rises by \(1^{\circ}\text{C}\) and rainfall decreases by 15 %. (c) What is the new vegetation classification after the change?
A. grassland
Correct B. savanna
C. desert
D. tropical moist forest

Correct Answer: B

Want to see the full step-by-step solution? Unlock AI Explanation & Analytics
Question 7 View Details
Infiltration capacity of a soil follows Horton's equation \( f(t)=f_{c}+\bigl(f_{0}-f_{c}\bigr)\,e^{-k t} \) where \(f(t)\) is the infiltration rate (mm h\(^{-1}\)) at time \(t\) (h) after ponding, \(f_{0}\) is the initial rate, \(f_{c}\) the steady‑state rate and \(k\) the decay constant. Field measurements give \(f_{0}=30\) mm h\(^{-1}\), \(f_{c}=5\) mm h\(^{-1}\) and after 2 h the rate is \(f(2)=12\) mm h\(^{-1}\). (a) Determine the decay constant \(k\) (h\(^{-1}\)). (b) Find the time required for the infiltration rate to fall to \(8\) mm h\(^{-1}\). Give your answer to two decimal places.
A. k = 0.64 h^{-1}, time = 2.80 h
B. k = 0.70 h^{-1}, time = 3.50 h
Correct C. k = 0.64 h^{-1}, time = 3.33 h
D. k = 0.58 h^{-1}, time = 3.10 h

Correct Answer: C

Want to see the full step-by-step solution? Unlock AI Explanation & Analytics
Question 8 View Details
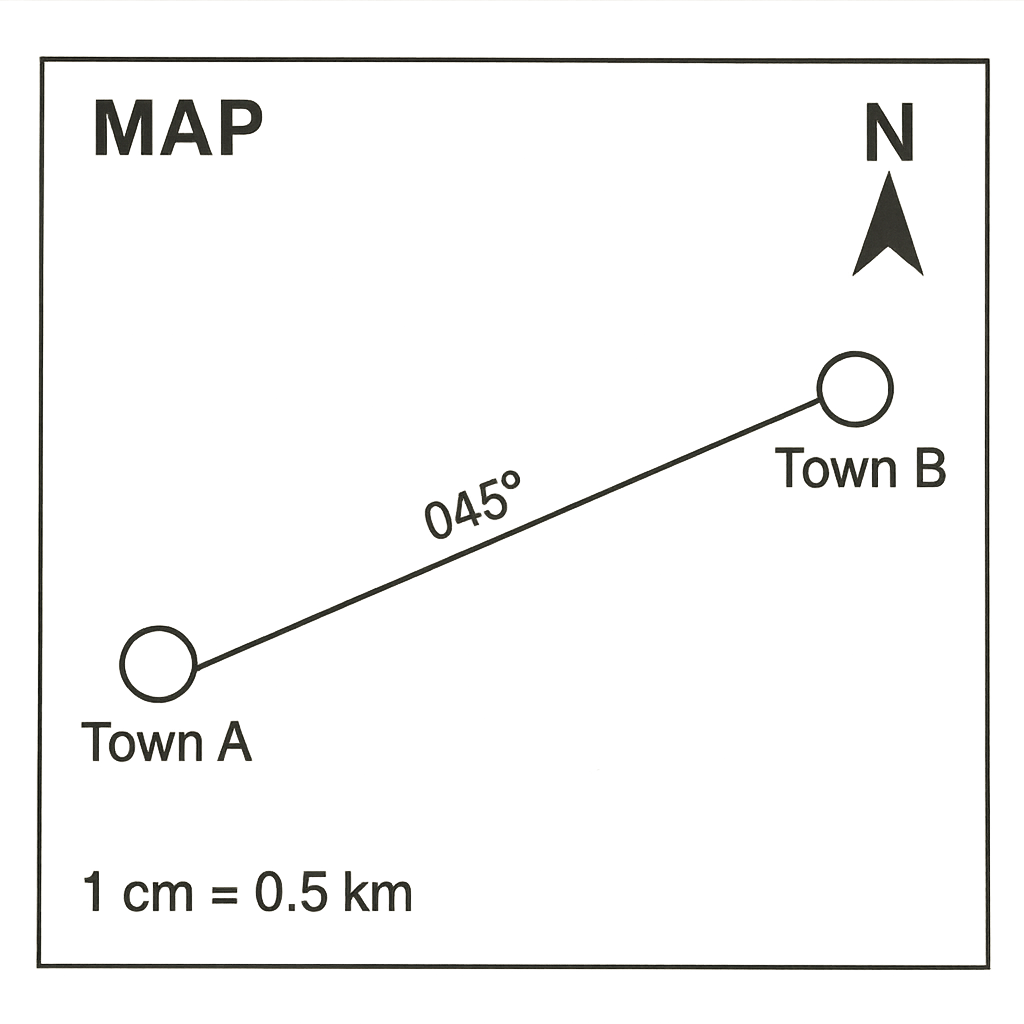
On the map, the distance between Town A and Town B measures 7.2 cm. The map scale is 1 cm : 0.5 km. (a) What is the actual ground distance between the towns in kilometres? (b) If the bearing from A to B is \(045^{\circ}\), express the direction as a compass point (e.g., NE).
Correct A. 3.6 km, NE
B. 14.4 km, NE
C. 3.6 km, NW
D. 0.36 km, SE

Correct Answer: A

Want to see the full step-by-step solution? Unlock AI Explanation & Analytics
Question 9 View Details
A river falls from an elevation of 350 m at point X to 120 m at point Y. On the map the straight‑line distance between X and Y is 8 cm. The map scale is 1 cm : 1 km. (a) Calculate the average gradient of the river valley as a percentage, rounded to one decimal place. (b) Classify the valley as "steep", "moderate" or "gentle" using the criteria: steep > 5 %, moderate 1 %-5 %, gentle < 1 %.
A. 0.8 %, gentle
B. 3.7 %, moderate
C. 5.2 %, steep
Correct D. 2.9 %, moderate

Correct Answer: D

Want to see the full step-by-step solution? Unlock AI Explanation & Analytics
Question 10 View Details
The table below gives the average monthly rainfall (mm) and temperature (°C) for a city. Rainfall (mm): Jan 120, Feb 80, Mar 100, Apr 150, May 200, Jun 250, Jul 300, Aug 280, Sep 220, Oct 180, Nov 140, Dec 130. Temperature (°C): Jan 28, Feb 29, Mar 30, Apr 31, May 32, Jun 33, Jul 34, Aug 34, Sep 33, Oct 31, Nov 30, Dec 28. (a) Compute the coefficient of variation (CV) of the rainfall series, expressed as a percentage to one decimal place. (b) Identify the month in which the ratio rainfall / temperature is greatest. (c) Approximate the Pearson correlation coefficient \(r\) between rainfall and temperature and state whether the relationship is strong, moderate or weak (use |r| > 0.8 as strong, 0.5-0.8 as moderate, <0.5 as weak).
Correct A. CV = 38.2 %, month = July, r ≈ 0.92 (strong positive correlation)
B. CV = 42.5 %, month = June, r ≈ 0.78 (moderate positive correlation)
C. CV = 33.1 %, month = August, r ≈ 0.65 (moderate positive correlation)
D. CV = 38.2 %, month = May, r ≈ 0.45 (weak positive correlation)

Correct Answer: A

Want to see the full step-by-step solution? Unlock AI Explanation & Analytics
Question 11 View Details
An area is situated at an altitude of 1200\,m. Temperature decreases with altitude at a lapse rate of 0.6\,\(^\circ\)C per 100\,m from a sea‑level mean temperature of 28\,\(^\circ\)C. The area receives an average annual rainfall of 950\,mm. Vegetation types are classified as follows:\n\n- Tropical rainforest: rainfall > 1500\,mm and temperature \(\geq\) 20\,\(^\circ\)C\n- Tropical savanna: 800\,mm \(\leq\) rainfall \(\leq\) 1500\,mm and 20\,\(^\circ\)C \(\leq\) temperature \(\leq\) 30\,\(^\circ\)C\n- Tropical grassland: 500\,mm \(\leq\) rainfall \(<\) 800\,mm and 15\,\(^\circ\)C \(\leq\) temperature \(\leq\) 25\,\(^\circ\)C\n- Subtropical shrubland: rainfall < 500\,mm and temperature \(>\) 10\,\(^\circ\)C\n\nDetermine the vegetation type of the area.
Correct A. Tropical savanna
B. Tropical rainforest
C. Subtropical shrubland
D. Tropical grassland

Correct Answer: A

Want to see the full step-by-step solution? Unlock AI Explanation & Analytics
Question 12 View Details
A region is exposed to two environmental hazards: flood and landslide. The annual probability of a flood is \(p_f\) and that of a landslide is \(p_l\). Their respective average monetary impacts are \(I_f = 3.5\) million Naira and \(I_l = 2.0\) million Naira. When both hazards occur in the same year, a synergy effect adds an extra loss of \(k = 5\) million Naira, modelled by the term \(k\,p_f\,p_l\). The total expected annual loss (including synergy) is 4.5 million Naira and it is known that \(p_f = 2p_l\). Determine the values of \(p_f\) and \(p_l\).
A. p_f \approx 0.600 (60.0\%), p_l \approx 0.300 (30.0\%)
Correct B. p_f \approx 0.716 (71.6\%), p_l \approx 0.358 (35.8\%)
C. p_f \approx 0.667 (66.7\%), p_l \approx 0.333 (33.3\%)
D. p_f \approx 0.800 (80.0\%), p_l \approx 0.400 (40.0\%)

Correct Answer: B

Want to see the full step-by-step solution? Unlock AI Explanation & Analytics
Question 13 View Details
The mean monthly temperatures (in \(^\circ\)C) for a location are: Jan 28, Feb 27, Mar ?, Apr 24, May 22, Jun 20, Jul 19, Aug 20, Sep 22, Oct 24, Nov 26, Dec 27. The reported annual mean temperature is 23\,\(^\circ\)C.\n\n(a) Determine the missing March temperature.\n(b) Based on the definition that a tropical climate requires **all** monthly mean temperatures to be at least 18\,\(^\circ\)C, state whether the location qualifies as tropical.
A. March temperature = 16\\,\\(^\\circ\\)C; the location is NOT tropical
B. March temperature = 17\\,\\(^\\circ\\)C; the location is tropical
C. March temperature = 18\\,\\(^\\circ\\)C; the location is tropical
Correct D. March temperature = 17\,\(^\circ\)C; the location is NOT tropical

Correct Answer: D

Want to see the full step-by-step solution? Unlock AI Explanation & Analytics
Question 14 View Details
A town had a population of 150,000 in the year 2010. Between 2010 and 2015 the natural increase (births minus deaths) contributed an average annual growth rate of 2.4\% per year, while net migration contributed an unknown average annual growth rate \(r\)\%. By the end of 2015 the population was recorded as 176,000. Assuming the two growth components act simultaneously and compound annually, determine the value of \(r\) (expressed as a percentage to two decimal places).
A. 1.24\%
Correct B. 0.84\%
C. 2.00\%
D. 0.64\%

Correct Answer: B

Want to see the full step-by-step solution? Unlock AI Explanation & Analytics
Question 15 View Details
A chemical plant releases a pollutant at a constant rate of \(Q = 500\) g·s\(^{-1}\). Under steady‑state conditions the ground‑level concentration \(C\) (in g·m\(^{-3}\)) at a downwind distance \(x\) (in km) is modelled by the Gaussian plume formula\n\n\[ C = \frac{Q}{\pi u \sigma^{2}} \]\n\nwhere the wind speed \(u = 2\) m·s\(^{-1}\) and the lateral dispersion parameter is \(\sigma = 0.3x\) km. The permissible exposure limit is \(L = 0.001\) g·m\(^{-3}\). Determine the minimum downwind distance \(x_{\min}\) (in km, to two decimal places) at which the concentration does not exceed the limit.
A. 1.12 km
B. 0.78 km
C. 0.86 km
Correct D. 0.94 km

Correct Answer: D

Want to see the full step-by-step solution? Unlock AI Explanation & Analytics
Question 16 View Details
A factory needs to transport 20\,tonnes of cargo from Port\,A to Factory\,B. Two possible routes are offered:\n\n- Route\,1 (road only): distance 240\,km, average speed \(60\ \text{km h}^{-1}\), fuel consumption 0.35\,L\,km\(^{-1}\), fuel price \(\text{₦}165\ \text{L}^{-1}\), tolls \(\text{₦}2,500\).\n\n- Route\,2 (rail + road): rail from Port\,A to Junction\,C (150\,km) at \(80\ \text{km h}^{-1}\) costing \(\text{₦}0.90\) per tonne‑km; road from C to B (80\,km) at \(50\ \text{km h}^{-1}\) with fuel consumption 0.30\,L\,km\(^{-1}\), same fuel price, tolls on the road segment \(\text{₦}1,200\).\n\nWhich route has the lower total cost? State the cheaper route and the cost difference (cheaper route cost minus the other route cost) in Naira, rounded to the nearest Naira.
A. Route 2; ₦7,860
Correct B. Route 2; ₦8,500
C. Route 2; ₦9,500
D. Route 1; ₦8,500

Correct Answer: B

Want to see the full step-by-step solution? Unlock AI Explanation & Analytics
Question 17 View Details
Five years ago a settlement had a population of 10,000. Today its population is 12,500. The settlement possesses a secondary school, a health centre, a weekly market (operating once a week) and a bank, and it lies 45\,km from the nearest city. According to the classification rule, a settlement is a town if its population is between 5,000 and 20,000 and it has at least two of the following facilities: secondary school, bank, health centre, market that operates at least twice a week; otherwise it is a village. Assuming the annual population growth rate remains constant, determine the projected population after three more years and state whether the settlement will be classified as a town or a village at that time.
Correct A. Town
B. City
C. Hamlet
D. Village

Correct Answer: A

Want to see the full step-by-step solution? Unlock AI Explanation & Analytics
Question 18 View Details
An industry plans to produce 5,000 units per month of a product. Each unit requires 2\,tonnes of raw material and the finished product weighs 0.5\,tonnes for transport. The raw material is sourced from Supplier\,X located 120\,km away, and the finished product is sold to Market\,Y located 80\,km away.\n\nTwo possible plant locations are considered:\n\n- Location\,A: 30\,km from Supplier\,X, 70\,km from Market\,Y; labour cost \(\text{₦}150\) per worker per day; requires 120 workers; operates 22 days per month.\n\n- Location\,B: 90\,km from Supplier\,X, 40\,km from Market\,Y; labour cost \(\text{₦}130\) per worker per day; requires 150 workers; operates 22 days per month.\n\nTransport cost per tonne‑km is \(\text{₦}0.75\) for raw material and \(\text{₦}0.60\) for the finished product.\n\nCalculate the total monthly cost (transport of raw material + transport of finished product + labour) for each location, identify the cheaper location, and give the cost difference (cheaper minus more expensive) in Naira, rounded to the nearest Naira.
A. Location B; ₦452,000
B. Location B; ₦438,000
C. Location A; ₦460,000
Correct D. Location A; ₦438,000

Correct Answer: D

Want to see the full step-by-step solution? Unlock AI Explanation & Analytics
Question 19 View Details
A farmer cultivates 8\,ha of maize. Expected yield is 5\,tonnes\,ha^{-1}. The crop requires 550\,mm of water over the growing season. The farmer has a reservoir covering 0.6\,ha with a water depth of 2.5\,m. Evaporation from the reservoir is 5\,mm per day for 120\,days. Groundwater can be pumped at a cost of \(\text{₦}0.45\) per\,m^{3}; irrigation from the reservoir (excluding evaporation loss) is free. The market price of maize is \(\text{₦}1,200\) per tonne and the production cost (excluding water) is \(\text{₦}300\) per tonne.\n\nDetermine whether the reservoir alone can meet the water requirement after accounting for evaporation loss. If not, calculate the additional volume of water that must be pumped (in m^{3}) and compute the net profit (revenue minus production cost and pumping cost), rounded to the nearest Naira.
A. Additional water: 34,100 m³; Net profit: ₦19,900
Correct B. Additional water: 32,600 m³; Net profit: ₦21,330
C. Additional water: 30,800 m³; Net profit: ₦20,750
D. Additional water: 31,500 m³; Net profit: ₦22,000

Correct Answer: B

Want to see the full step-by-step solution? Unlock AI Explanation & Analytics
Question 20 View Details
On a map the scale is 1\,cm\,:\,2\,km. The measured distance between Town\,X and Town\,Y on the map is 7.5\,cm. What is the actual distance between the towns in kilometres? Give your answer to one decimal place.
Correct A. 15
B. 3.8
C. 15.5
D. 150

Correct Answer: A

Want to see the full step-by-step solution? Unlock AI Explanation & Analytics
Question 21 View Details
Vegetation type A (savanna) requires annual rainfall between \(500\\ \text{mm}\) and \(1200\\ \text{mm}\). Vegetation type B (forest) requires a minimum annual rainfall of \(1500\\ \text{mm}\). An area currently receives \(1400\\ \text{mm}\) of rainfall and has an average annual temperature of \(28^{\\circ}\\text{C}\). If the temperature rises by \(2^{\\circ}\\text{C}\), the minimum rainfall needed for forest vegetation increases by \(5\\%\) for each degree Celsius increase. Determine whether the area will still be suitable for forest vegetation after the temperature rise.
A. Yes, the area will still be suitable for forest vegetation.
Correct B. No, the area will not be suitable for forest vegetation.
C. No, the area will be suitable for savanna vegetation.
D. Yes, the area will be suitable for savanna vegetation.

Correct Answer: B

Want to see the full step-by-step solution? Unlock AI Explanation & Analytics
Question 22 View Details
Station A at sea level records a maximum temperature of \(34^{\\circ}\\text{C}\) on a certain day. Station B, located at \(1500\\ \text{m}\) above sea level, records a maximum temperature of \(28^{\\circ}\\text{C}\) on the same day. Assuming the environmental lapse rate is \(6.5^{\\circ}\\text{C}\) per 1000\,m, determine whether the observed temperature difference between the two stations is consistent with the lapse rate. If not, calculate the temperature anomaly at Station B (the amount by which the observed temperature exceeds the expected temperature).
A. The observed difference is not consistent; the temperature anomaly at Station B is +2.25°C.
B. The observed difference is not consistent; the temperature anomaly at Station B is -3.75°C.
C. The observed difference is consistent with the lapse rate; the temperature anomaly at Station B is 0°C.
Correct D. The observed difference is not consistent; the temperature anomaly at Station B is +3.75°C.

Correct Answer: D

Want to see the full step-by-step solution? Unlock AI Explanation & Analytics
Question 23 View Details
A location has the following average monthly temperatures (°C): Jan 22, Feb 24, Mar 26, Apr 28, May 30, Jun 28, Jul 27, Aug 27, Sep 26, Oct 24, Nov 23, Dec 22. The average monthly precipitation (mm) is: Jan 80, Feb 70, Mar 60, Apr 50, May 40, Jun 30, Jul 20, Aug 20, Sep 30, Oct 40, Nov 60, Dec 70. Using the Köppen climate classification system, determine the climate type (main group and subtype) for this location.
A. BSh
B. Cw
Correct C. Aw
D. Af

Correct Answer: C

Want to see the full step-by-step solution? Unlock AI Explanation & Analytics
Question 24 View Details
Two regions have the following data:\n\nRegion X: area \(12{,}000\\ \text{km}^{2}\), population \(3{,}600{,}000\), agricultural land \(45\\%\) of its area, GDP per capita \(\$2{,}500\), projected temperature rise by 2050 \(1.8^{\\circ}\\text{C}\).\n\nRegion Y: area \(8{,}000\\ \text{km}^{2}\), population \(2{,}400{,}000\), agricultural land \(30\\%\) of its area, GDP per capita \(\$3{,}200\), projected temperature rise by 2050 \(1.2^{\\circ}\\text{C}\).\n\nDefine a vulnerability index \(V = \frac{\text{population density}\times\%\text{agricultural land}}{\text{GDP per capita}}\). Then adjust it for climate risk by multiplying by \((1 + \frac{\text{temperature rise}}{2})\). Compute the final vulnerability index for each region and state which region is more vulnerable to climate change.
A. Region Y is more vulnerable (final index ≈ 10.26 versus 4.5 for Region X).
B. Region X is more vulnerable (final index ≈ 10.26 versus 5.0 for Region Y).
Correct C. Region X is more vulnerable (final index ≈ 10.26 versus 4.5 for Region Y).
D. Region X is more vulnerable (final index ≈ 9.8 versus 5.2 for Region Y).

Correct Answer: C

Want to see the full step-by-step solution? Unlock AI Explanation & Analytics
Question 25 View Details
Three settlements have the following characteristics:\n\n- Settlement A: population 8 000; services - secondary school, hospital, market; distance to B is 12 km, to C is 20 km.\n- Settlement B: population 3 000; services - primary school, market; distance to A is 12 km, to C is 15 km.\n- Settlement C: population 2 500; services - primary school only; distance to A is 20 km, to B is 15 km.\n\nAccording to Central Place Theory, a settlement qualifies as a central place of rank n if it provides at least n higher‑order services and its population exceeds 5 000. Identify which settlement, if any, qualifies as a central place of rank 2.
A. None of the settlements
Correct B. Settlement A
C. Settlement C
D. Settlement B

Correct Answer: B

Want to see the full step-by-step solution? Unlock AI Explanation & Analytics

Master the Exam!

You've seen a preview, but there are thousands more questions plus AI tutor to break down complex solutions.

Unlock Full Access Available for Android & Windows
Help others prepare! Share this practice hub:
Chat with Support