gce model questions vol1 2024 geography | Objective

Prepare for your exams with gce model questions vol1 questions? Reviewing past/model questions is one of the most effective ways to guarantee a high score. This practice hub features authentic 2024 geography (Objective) questions designed to simulate the real exam environment.

Practice these randomly selected questions to test your readiness.

Question 1 View Details
Annual rainfall in a region is normally distributed with mean \(1200\) mm and standard deviation \(200\) mm. A landslide occurs in a year when the rainfall exceeds \(1500\) mm. If a landslide occurs, the average damage cost is £\(2.5\) million. Two mitigation options are available:\n\n- Option A costs £\(0.8\) million per year and reduces the probability of a landslide by 40 %.\n- Option B costs £\(1.2\) million per year and reduces the average damage per landslide by 30 %.\n\nWhich option results in the lower expected annual cost (including mitigation cost and expected damage)?
A. Option B
Correct B. Option A
C. Option C
D. Option D

Correct Answer: B

Want to see the full step-by-step solution? Unlock AI Explanation & Analytics
Question 2 View Details
A river drops from an elevation of \(350\) m to \(20\) m over a straight‑line distance of \(80\) km. The river's meander factor is \(1.4\) (i.e., its actual length is \(1.4\) times the straight‑line distance). Calculate the average gradient in metres per kilometre and state whether the river is steep (gradient > 10 m km\(^{-1}\)), moderate (4 - 10 m km\(^{-1}\)) or gentle (< 4 m km\(^{-1}\)).
Correct A. gentle
B. steep
C. moderate
D. moderately gentle

Correct Answer: A

Want to see the full step-by-step solution? Unlock AI Explanation & Analytics
Question 3 View Details
Two routes connect city A to city B.\n\nRoute 1: 150 km of highway with a speed limit of 100 km h\(^{-1}\). Traffic reduces the speed by 30 km h\(^{-1}\) for 20 % of the travel time. A toll of £\(5\) is charged.\n\nRoute 2: 180 km of mixed road - the first 80 km at 80 km h\(^{-1}\), the remaining 100 km at 60 km h\(^{-1}\). A ferry crossing adds 45 minutes and costs £\(12\).\n\nThe vehicle consumes 8 L per 100 km and fuel costs £\(1.40\) per litre. Which route has the lower total cost (fuel + toll/ferry) and also the lower total travel time? Answer "Route 1", "Route 2", or "Both have the same cost/time".
A. Route 2
B. Both have the same cost/time
Correct C. Route 1
D. Route 2 (higher cost)

Correct Answer: C

Want to see the full step-by-step solution? Unlock AI Explanation & Analytics
Question 4 View Details
Station X records a sea‑level pressure of \(1012\) hPa, while station Y, located \(200\) km to the north, records \(1004\) hPa. Assuming the pressure gradient is linear and the air density is \(1.2\) kg m\(^{-3}\), estimate the geostrophic wind speed at latitude \(45^{\circ}\) using the formula \(V = \frac{1}{\rho f}\frac{\Delta p}{\Delta n}\), where \(f = 2\Omega\sin\phi\) and \(\Omega = 7.292\times10^{-5}\) s\(^{-1}\). Give your answer in metres per second (m s\(^{-1}\)), rounded to the nearest whole number.
Correct A. 32 m/s
B. 35 m/s
C. 28 m/s
D. 40 m/s

Correct Answer: A

Want to see the full step-by-step solution? Unlock AI Explanation & Analytics
Question 5 View Details
Using the Kirpich formula \(T_c = 0.0195 L^{0.77} S^{-0.385}\) (with \(L\) in metres and \(T_c\) in minutes), calculate the time of concentration for a catchment that is \(2.5\) km long with an average slope of \(4\%\). If a storm delivers a rainfall intensity of \(20\) mm h\(^{-1}\) for \(30\) minutes, does the rainfall duration exceed the time of concentration, indicating a high flash‑flood risk? Answer "Yes" or "No".
Correct A. Yes
B. No
C. Uncertain
D. Maybe

Correct Answer: A

Want to see the full step-by-step solution? Unlock AI Explanation & Analytics
Question 6 View Details
The town of Lagosville had a population of \(120{,}000\) in the year 2000. Between 2000 and 2010 it grew at an average annual rate of \(2\%\). From 2010 to 2020 the growth rate slowed to \(1.5\%\) per year. The 2020 census recorded a population of \(150{,}000\). Is this figure consistent with the given growth rates? If not, calculate the population that would be expected in 2020 and state the difference between the expected and the recorded figure (rounded to the nearest hundred).
A. Expected 2020 population ≈ 165,000; discrepancy ≈ 15,000
B. Expected 2020 population ≈ 172,500; discrepancy ≈ 22,500
C. Expected 2020 population ≈ 160,200; discrepancy ≈ 10,200
Correct D. Expected 2020 population ≈ 169,800; discrepancy ≈ 19,800

Correct Answer: D

Want to see the full step-by-step solution? Unlock AI Explanation & Analytics
Question 7 View Details
Region A lies at sea level and has the following monthly average temperatures (°C): 22, 24, 26, 28, 30, 32, 33, 33, 31, 28, 24, 22. Its monthly rainfall (mm) is: 120, 110, 130, 150, 180, 200, 210, 190, 170, 150, 130, 120.\nRegion B is situated at an altitude of \(800\) m. The mean temperature at that altitude is \(20\) °C. The total annual rainfall in Region B is \(1800\) mm and the monthly distribution is given as percentages of the annual total: Jan 8 %, Feb 7 %, Mar 9 %, Apr 10 %, May 12 %, Jun 13 %, Jul 14 %, Aug 13 %, Sep 9 %, Oct 7 %, Nov 5 %, Dec 3 %.\nCoffee grows best where the mean temperature is between \(15\) °C and \(24\) °C and annual rainfall exceeds \(1500\) mm. Using a lapse rate of \(6.5\) °C per 1000 m, decide which region is suitable for coffee cultivation.
A. Region A is suitable for coffee cultivation; Region B is not.
B. Region A is not suitable for coffee cultivation; Region B is not suitable for coffee cultivation.
C. Region B is not suitable for coffee cultivation; Region A is suitable.
Correct D. Region B is suitable for coffee cultivation; Region A is not.

Correct Answer: D

Want to see the full step-by-step solution? Unlock AI Explanation & Analytics
Question 8 View Details
A country has a total area of \(150{,}000\) km² and a total population of \(50{,}000{,}000\). The population is distributed among three zones:\n- Coastal zone: area \(30{,}000\) km², population density \(800\) persons/km².\n- Highland zone: area \(50{,}000\) km², population density \(300\) persons/km².\n- Interior zone: area unknown.\nUrbanisation rates are: 40 % of the coastal population lives in cities, 25 % of the highland population, and 15 % of the interior population. Determine the area of the interior zone, its population density (rounded to the nearest whole person per km²), and which zone contributes the greatest number of urban dwellers.
Correct A. Interior area = 70,000 km²; interior density ≈ 157 persons/km²; coastal zone provides the most urban dwellers.
B. Interior area = 65,000 km²; interior density ≈ 143 persons/km²; highland zone provides the most urban dwellers.
C. Interior area = 75,000 km²; interior density ≈ 171 persons/km²; interior zone provides the most urban dwellers.
D. Interior area = 70,000 km²; interior density ≈ 150 persons/km²; coastal zone provides the most urban dwellers.

Correct Answer: A

Want to see the full step-by-step solution? Unlock AI Explanation & Analytics
Question 9 View Details
A rectangular irrigation canal is 4 m wide and 2 m deep. Its slope is \(0.0015\) and the Manning roughness coefficient is \(n = 0.025\).\n(a) Calculate the maximum discharge of the canal in cubic metres per second using Manning's equation.\n(b) A farm downstream requires \(12{,}000\) m³ of water per day. Can the canal meet this demand? Show all steps.
A. Maximum discharge ≈ 10.2 m³\/s; daily capacity ≈ 880 000 m³, so the canal cannot meet the 12 000 m³/day demand.
Correct B. Maximum discharge ≈ 12.4 m³/s; daily capacity ≈ 1 070 000 m³, so the canal can meet the 12 000 m³/day demand.
C. Maximum discharge ≈ 12.4 m³\/s; daily capacity ≈ 900 000 m³, so the canal can meet the 12 000 m³/day demand.
D. Maximum discharge ≈ 13.6 m³\/s; daily capacity ≈ 1 175 000 m³, so the canal can meet the 12 000 m³/day demand.

Correct Answer: B

Want to see the full step-by-step solution? Unlock AI Explanation & Analytics
Question 10 View Details
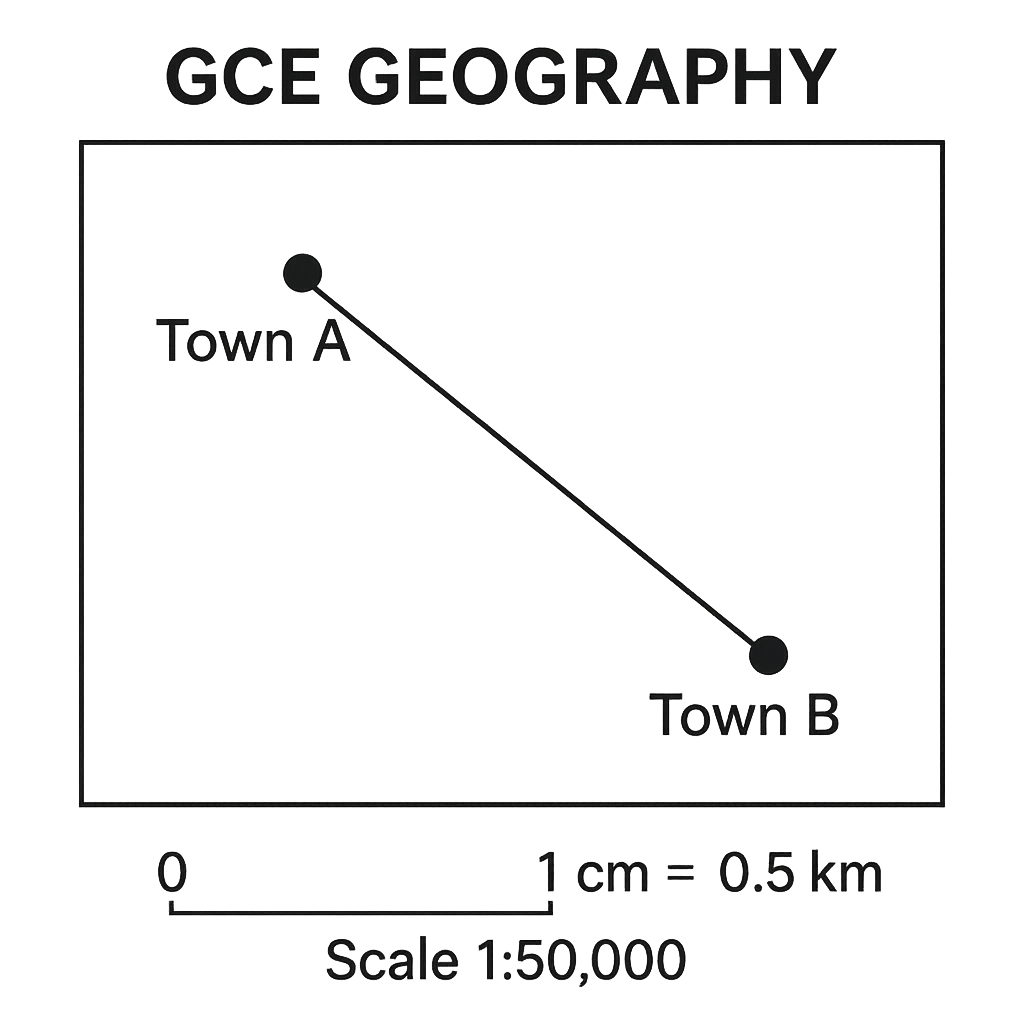
A map of the Riverland region is drawn at a scale of 1 : 50 000. On the map the straight‑line distance between Town A and Town B measures \(4.2\) cm. What is the actual distance between the two towns in kilometres?
A. 0.84 km
Correct B. 2.1 km
C. 8.4 km
D. 210 km

Correct Answer: B

Want to see the full step-by-step solution? Unlock AI Explanation & Analytics
Question 11 View Details
Using the Köppen climate classification, determine the main climate group (A, B, C, D, or E) for a region with the following data: mean annual temperature \(15^{\circ}\text{C}\), total annual precipitation \(800\ \text{mm}\), 60 % of the precipitation falls in the summer half‑year, and the mean temperature of the coldest month is \(-2^{\circ}\text{C}\).
Correct A. D
B. C
C. B
D. E

Correct Answer: A

Want to see the full step-by-step solution? Unlock AI Explanation & Analytics
Question 12 View Details
A town had a population of 120 000 in the year 2015. The birth rate was 18 per 1 000 population per year and the death rate was 7 per 1 000 population per year. Assuming these rates remained constant and that net migration was the same each year, the population in 2020 was recorded as 138 000. Calculate the average net migration per year (number of people).
Correct A. 2280
B. 2480
C. 2380
D. 2080

Correct Answer: A

Want to see the full step-by-step solution? Unlock AI Explanation & Analytics
Question 13 View Details
The yield of a crop (in tonnes per hectare) depends on the amount of nitrogen fertilizer applied according to the relation \(Y = 2x - 0.01x^{2}\), where \(x\) is the quantity of fertilizer in kilograms per hectare. Fertilizer costs \(\$0.50\) per kilogram and the crop sells for \(\$200\) per tonne. Determine the amount of fertilizer (kg ha\(^{-1}\)) that maximises profit and state the maximum profit per hectare (to the nearest dollar).
A. 120 kg\/ha, $21,600
B. 90 kg\/ha, $18,000
C. 80 kg\/ha, $15,800
Correct D. 100 kg/ha, $19,950

Correct Answer: D

Want to see the full step-by-step solution? Unlock AI Explanation & Analytics
Question 14 View Details
A river originates at an elevation of 800 m and enters the sea at 100 m above sea level, giving a total fall of 700 m over a length of 120 km. A waterfall dropping 50 m is located 30 km downstream from the source. Apart from the waterfall, the river has a uniform gradient upstream of the waterfall and a different uniform gradient downstream. If the upstream gradient (excluding the waterfall) is twice the downstream gradient, calculate the average gradient (in metres per kilometre, to one decimal place) of the upstream and downstream reaches.
A. Upstream gradient ≈ 9.5 m\/km, downstream gradient ≈ 4.8 m\/km
B. Upstream gradient ≈ 10.0 m\/km, downstream gradient ≈ 5.0 m\/km
Correct C. Upstream gradient ≈ 8.7 m/km, downstream gradient ≈ 4.3 m/km
D. Upstream gradient ≈ 7.0 m\/km, downstream gradient ≈ 3.5 m\/km

Correct Answer: C

Want to see the full step-by-step solution? Unlock AI Explanation & Analytics
Question 15 View Details
Three environmental hazards have the following annual probabilities of occurrence and associated monetary consequences:\n\n- Hazard A: probability \(0.02\), consequence \(\$500{,}000\)\n- Hazard B: probability \(0.05\), consequence \(\$300{,}000\)\n- Hazard C: probability \(0.01\), consequence \(\$800{,}000\)\n\nRisk is defined as probability × consequence. A mitigation budget allows two of the following actions:\n\n1. Reduce the probability of Hazard A by 20 %\n2. Reduce the probability of Hazard B by 30 %\n3. Reduce the probability of Hazard C by 40 %\n\nWhich two actions should be taken to achieve the greatest possible reduction in total risk? State the selected hazards.
A. Hazards B and A
Correct B. Hazards B and C
C. Hazards A and C
D. Hazards A and B

Correct Answer: B

Want to see the full step-by-step solution? Unlock AI Explanation & Analytics
Question 16 View Details
The population of Country X was \(12.5\) million in the year 2000 and \(15.8\) million in 2015. Assuming the population grew at a constant annual exponential rate, estimate the population in 2025. Give your answer in millions, rounded to one decimal place.
A. 19.0
Correct B. 18.5
C. 18.0
D. 17.5

Correct Answer: B

Want to see the full step-by-step solution? Unlock AI Explanation & Analytics
Question 17 View Details
Map A has a scale of 1 cm : 5 km and Map B has a scale of 1 cm : 8 km. A road is shown as 3.2 cm on Map A and 2.5 cm on Map B. Which map shows the longer actual length of the road, and what is that length in kilometres? Give the length as an integer.
Correct A. Map B, 20
B. Map A, 20
C. Map B, 16
D. Map A, 16

Correct Answer: A

Want to see the full step-by-step solution? Unlock AI Explanation & Analytics
Question 18 View Details
A soil sample contains 30 % sand, 45 % silt and 25 % clay. Using the empirical estimate \(FC = 0.2S + 0.3Si + 0.5C\) (where \(S, Si, C\) are the respective percentages), calculate the field capacity as a percentage of volumetric water content. Give your answer as a whole number percentage.
Correct A. 32
B. 30
C. 28
D. 35

Correct Answer: A

Want to see the full step-by-step solution? Unlock AI Explanation & Analytics
Question 19 View Details
Industry A has a direct employment of 12 000 workers and a Type I employment multiplier of 2.5. Its direct output is £480 million and the Type II output multiplier is 3.2. Industry B employs 8 000 workers directly with a Type I multiplier of 3.0, a direct output of £560 million and a Type II multiplier of 4.0. (a) Calculate the total employment (direct + indirect) for each industry using the Type I multiplier. (b) Calculate the total output for each industry using the Type II multiplier. (c) Determine which industry generates the higher output per total employee, and state that output per employee in £ (rounded to the nearest hundred).
A. Industry B, 91000
Correct B. Industry B, 93300
C. Industry A, 91000
D. Industry A, 93300

Correct Answer: B

Want to see the full step-by-step solution? Unlock AI Explanation & Analytics
Question 20 View Details
Monthly average temperatures (°C) and precipitation (mm) for a location are: Jan: 12 °C, 80 mm; Feb: 13 °C, 70 mm; Mar: 15 °C, 60 mm; Apr: 18 °C, 55 mm; May: 22 °C, 70 mm; Jun: 26 °C, 85 mm; Jul: 28 °C, 90 mm; Aug: 27 °C, 95 mm; Sep: 24 °C, 80 mm; Oct: 19 °C, 70 mm; Nov: 15 °C, 75 mm; Dec: 12 °C, 85 mm. Using the Köppen climate classification criteria, assign the appropriate climate type (e.g., Af, Cfa, etc.).
Correct A. Cfa
B. Cfb
C. Cwa
D. Dfa

Correct Answer: A

Want to see the full step-by-step solution? Unlock AI Explanation & Analytics
Question 21 View Details
A farmer intends to grow maize on 5 ha. The expected yield without fertilizer is 2.5 t ha⁻¹. Each kilogram of nitrogen applied per hectare increases the yield by 0.02 t ha⁻¹, up to a maximum increase of 1.5 t ha⁻¹. Nitrogen fertilizer costs ₦120 per kg and the market price of maize is ₦300 per kg. The farmer has a budget of ₦90 000 for fertilizer. Determine the total amount of nitrogen (kg) the farmer should apply to maximise profit without exceeding the budget, and calculate the maximum profit (in naira).
Correct A. Apply 375 kg of nitrogen (75 kg ha⁻¹); maximum profit = ₦5 955 000
B. Apply 500 kg of nitrogen (100 kg ha⁻¹); maximum profit = ₦5 500 000
C. Apply 375 kg of nitrogen (75 kg ha⁻¹); maximum profit = ₦5 500 000
D. Apply 300 kg of nitrogen (60 kg ha⁻¹); maximum profit = ₦6 200 000

Correct Answer: A

Want to see the full step-by-step solution? Unlock AI Explanation & Analytics
Question 22 View Details
A city records the following daily maximum and minimum temperatures (°C) over a week: Day 1 30/20, Day 2 32/21, Day 3 31/19, Day 4 33/22, Day 5 34/23, Day 6 35/22, Day 7 33/21. The relative humidity at the maximum temperature is 60 % each day and at the minimum temperature is 80 % each day. Approximate the daily mean temperature as the average of the max and min, and the daily mean relative humidity as the average of the two humidity values. Using the heat‑index formula (HI = T + 0.33e - 0.70v - 4.00), where (e = \frac{RH}{100}\times6.105\times\exp\!\left(\frac{17.27T}{237.7+T}\right)\) (hPa) and wind speed (v) is a constant 2 m s⁻¹, identify the day with the highest heat index and give the heat‑index value (rounded to the nearest °C).
A. Day 6 - Heat Index ≈ 33 °C
Correct B. Day 5 (or Day 6) - Heat Index ≈ 32 °C
C. Day 4 - Heat Index ≈ 31 °C
D. Day 5 - Heat Index ≈ 30 °C

Correct Answer: B

Want to see the full step-by-step solution? Unlock AI Explanation & Analytics
Question 23 View Details
A rock sequence consists of three layers: Layer A (basalt) contains a mineral dated by the K-Ar method at 150 ± 5 Ma; Layer B (sandstone) contains a fossil that indicates a minimum age of 120 Ma; Layer C (limestone) contains a zircon grain that yields a concordant U-Pb age of 110 ± 3 Ma. Assuming no post‑depositional alteration, determine the most probable age range (in millions of years) for the deposition of the sandstone Layer B and explain any apparent discrepancy between the fossil and the radiometric ages.
Correct A. Between 120 Ma and 150 Ma; the fossil gives a minimum age that is compatible with the radiometric ages of the adjacent layers, so no real discrepancy exists.
B. Between 115 Ma and 145 Ma; the fossil provides a maximum age, which contradicts the younger radiometric dates.
C. Between 110 Ma and 130 Ma; the fossil appears older than the radiometric ages, suggesting a discrepancy.
D. Between 130 Ma and 160 Ma; the fossil age conflicts with the radiometric ages, indicating possible reworking.

Correct Answer: A

Want to see the full step-by-step solution? Unlock AI Explanation & Analytics
Question 24 View Details
A coastal town faces two hazards. Storm surges of height ≥3 m occur on average once every 15 years, causing average property damage of ₦2.5 million per event. Coastal erosion advances the shoreline at 0.8 m yr⁻¹; a 150 m seawall protects 0.5 m yr⁻¹ of shoreline, otherwise the town would lose 30 houses (valued at ₦1.2 million each) over 20 years. The town can extend the seawall at a cost of ₦18 million, increasing protection to 0.9 m yr⁻¹. Using a 20‑year planning horizon and a discount rate of 5 % p.a., calculate the net present value (NPV) of expected loss without the extension, and the NPV of expected loss with the extension (including construction cost). Should the town proceed with the extension? Provide the decision.
A. Without extension NPV ≈ ₦11.0 million; with extension NPV ≈ ₦11.0 million; the town should be indifferent about the extension.
B. Without extension NPV ≈ ₦15.0 million; with extension NPV ≈ ₦9.3 million; the town should proceed with the extension.
Correct C. Without extension NPV ≈ ₦10.5 million; with extension NPV ≈ ₦20.1 million; the town should not proceed with the extension.
D. Without extension NPV ≈ ₦8.2 million; with extension NPV ≈ ₦12.4 million; the town should proceed with the extension.

Correct Answer: C

Want to see the full step-by-step solution? Unlock AI Explanation & Analytics
Question 25 View Details
A logistics company must transport goods from City X to City Y (300 km). Two routes are available: • Route A: 300 km highway, speed limit 100 km h⁻¹. Traffic adds a delay of 0.5 h for every 50 km travelled beyond the first 100 km. Fuel consumption on the highway is 8 L 100 km⁻¹. • Route B: 260 km mixed road (average speed 80 km h⁻¹, fuel 10 L 100 km⁻¹) plus a 40 km mountain pass (speed 40 km h⁻¹, fuel 15 L 100 km⁻¹). Fuel price is ₦150 L⁻¹ and driver time is valued at ₦200 h⁻¹. Determine which route gives the lower total cost (fuel + driver time) and give the total cost rounded to the nearest thousand naira.
A. Route B is cheaper; total cost ≈ ₦4 000 (rounded to the nearest thousand)
B. Route B is cheaper; total cost ≈ ₦5 000 (rounded to the nearest thousand)
C. Route A is cheaper; total cost ≈ ₦6 000 (rounded to the nearest thousand)
Correct D. Route A is cheaper; total cost ≈ ₦5 000 (rounded to the nearest thousand)

Correct Answer: D

Want to see the full step-by-step solution? Unlock AI Explanation & Analytics

Master the Exam!

You've seen a preview, but there are thousands more questions plus AI tutor to break down complex solutions.

Unlock Full Access Available for Android & Windows
Help others prepare! Share this practice hub:
Chat with Support