gce model questions vol1 2020 geography | Objective

Prepare for your exams with gce model questions vol1 questions? Reviewing past/model questions is one of the most effective ways to guarantee a high score. This practice hub features authentic 2020 geography (Objective) questions designed to simulate the real exam environment.

Practice these randomly selected questions to test your readiness.

Question 1 View Details
A farmer plans to fertilise a 10‑ha wheat field. The crop requires a total of \(120\,\text{kg}\) of nitrogen per hectare. The farmer has two fertilisers: Fertiliser A contains \(30\%\) N and \(5\%\) P and costs $0.50 per kg; Fertiliser B contains \(10\%\) N and \(20\%\) P and costs $0.30 per kg. The field also needs a total of \(40\,\text{kg}\) of phosphorus per hectare. Determine how many kilograms of each fertiliser the farmer should apply to meet exactly both the nitrogen and phosphorus requirements, and calculate the minimum total cost (to the nearest dollar).
Correct A. Fertiliser A ≈ 3636 kg, Fertiliser B ≈ 1092 kg; minimum total cost ≈ $2146
B. Fertiliser A ≈ 4000 kg, Fertiliser B ≈ 800 kg; minimum total cost ≈ $2250
C. Fertiliser A ≈ 3500 kg, Fertiliser B ≈ 1200 kg; minimum total cost ≈ $2100
D. Fertiliser A ≈ 3800 kg, Fertiliser B ≈ 1000 kg; minimum total cost ≈ $2180

Correct Answer: A

Want to see the full step-by-step solution? Unlock AI Explanation & Analytics
Question 2 View Details
Country X had a population of \(5\) million in the year 2000. Its birth rate was \(22\) per 1 000, death rate \(8\) per 1 000 and net migration was a loss of \(0.5\%\) per year. Assuming these rates remain constant, estimate the population in the year 2020 (to the nearest thousand).
Correct A. 5,980,000
B. 6,120,000
C. 5,850,000
D. 5,700,000

Correct Answer: A

Want to see the full step-by-step solution? Unlock AI Explanation & Analytics
Question 3 View Details
A rectangular agricultural field of area \(0.1\) km² has a uniform slope of \(0.001\). During a storm the rainfall intensity is \(20\) mm h⁻¹ for 2 h, and the runoff coefficient is \(0.3\). Using the Rational method, calculate the peak runoff discharge \(Q\) in cubic metres per second. The drainage system consists of a circular pipe laid on the same slope, with Manning's roughness coefficient \(n = 0.013\). Determine the minimum pipe diameter (in metres, to two decimal places) that can convey this discharge when flowing full. (Use \(\sqrt{0.001}=0.03162\) and \(2^{4/3}=2.52\) for calculations.)
A. 0.68 m
B. 0.45 m
Correct C. 0.57 m
D. 0.52 m

Correct Answer: C

Want to see the full step-by-step solution? Unlock AI Explanation & Analytics
Question 4 View Details
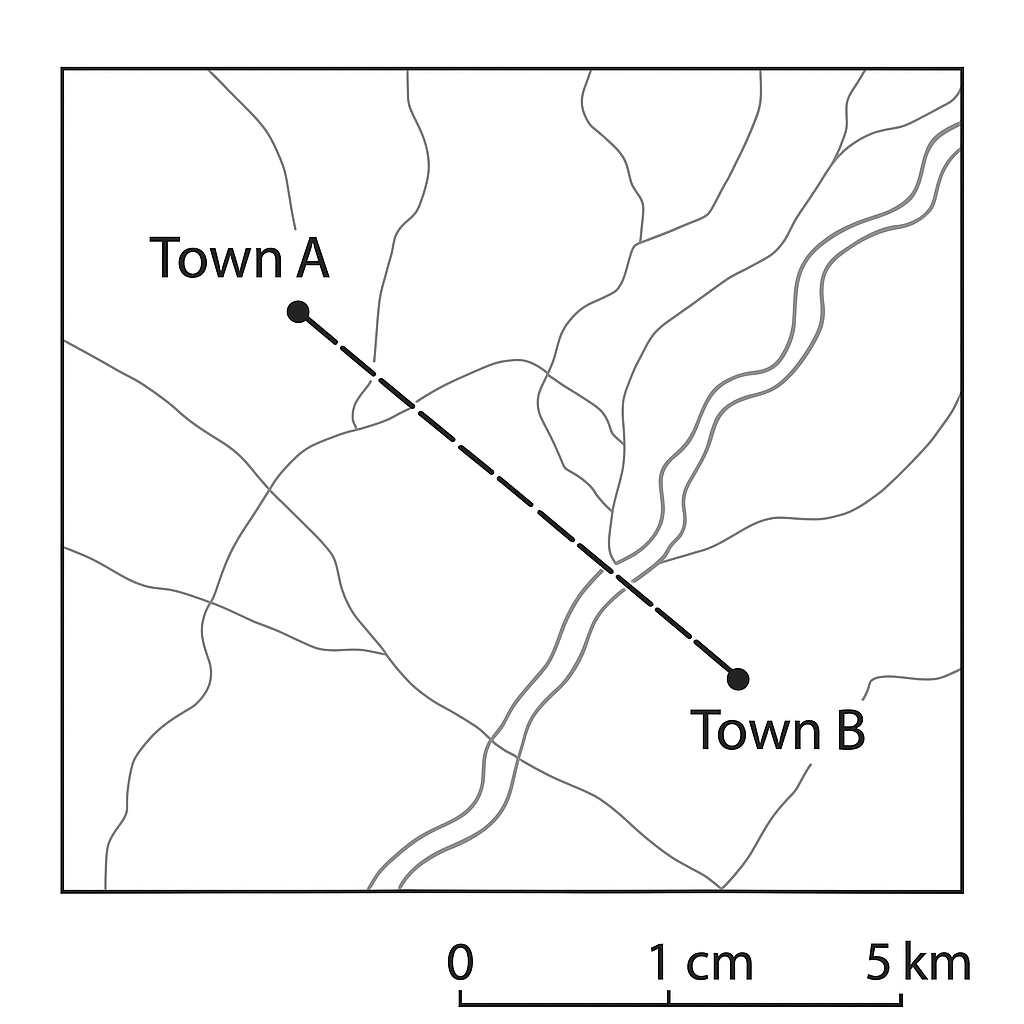
A topographic map has a scale of 1 cm : 5 km. On the map the straight‑line distance between Town A and Town B measures 7 cm. What is the actual distance between the two towns in kilometres?
Correct A. 35 km
B. 30 km
C. 42 km
D. 28 km

Correct Answer: A

Want to see the full step-by-step solution? Unlock AI Explanation & Analytics
Question 5 View Details
Three regions (A, B and C) are being compared for climate classification and tea‑plant suitability. The data are:\n\nRegion A: altitude 800 m, observed mean annual temperature 16 °C, annual rainfall 1900 mm.\nRegion B: altitude 200 m, observed mean annual temperature 22 °C, annual rainfall 2100 mm.\nRegion C: altitude 1500 m, observed mean annual temperature 12 °C, annual rainfall 1600 mm.\n\nAssume a standard lapse rate of 6.5 °C per 1000 m to convert observed temperatures to sea‑level equivalents. Using the simplified rule that a region with sea‑level mean temperature below 22 °C is classified as Köppen Cfb (temperate oceanic), identify which regions are Cfb. Tea cultivation requires rainfall between 1500 mm and 2500 mm and a mean temperature at the growing altitude between 18 °C and 22 °C. Indicate which region(s) meet the tea‑cultivation requirements.
A. Cfb climates: Regions B and C. Tea‑suitable region: Region A.
B. Cfb climates: Regions A and B. Tea‑suitable region: Region C.
Correct C. Cfb climates: Regions A and C. Tea‑suitable region: Region B.
D. Cfb climates: Region A only. Tea‑suitable region: Regions B and C.

Correct Answer: C

Want to see the full step-by-step solution? Unlock AI Explanation & Analytics
Question 6 View Details
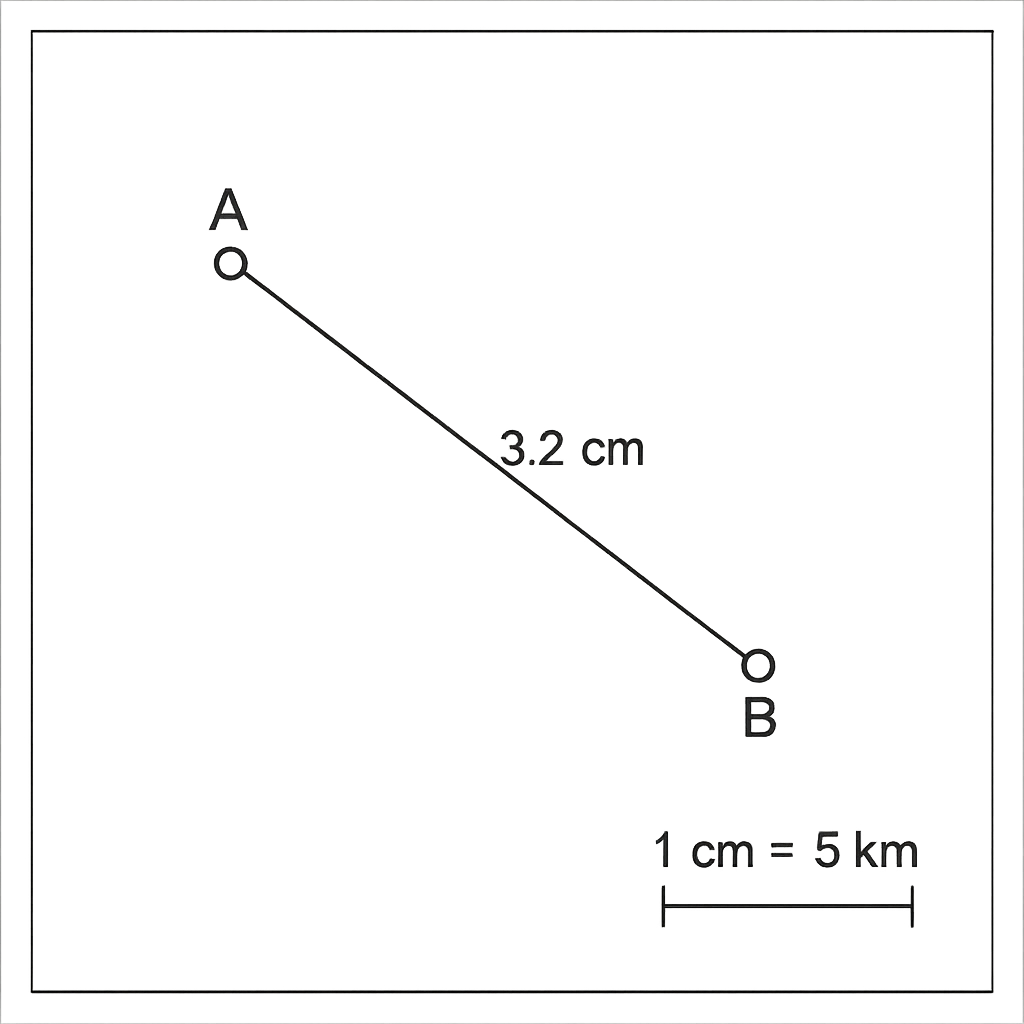
On the map the scale is \(1\text{ cm}=5\text{ km}\). The straight‑line distance between Town\,A and Town\,B measures \(3.2\text{ cm}\) on the map. What is the actual distance between the towns in kilometres?
A. 12.8
B. 17
Correct C. 16
D. 15

Correct Answer: C

Want to see the full step-by-step solution? Unlock AI Explanation & Analytics
Question 7 View Details
Between 2000 and 2010 a region experienced 4 minor floods, 3 moderate floods, 2 severe floods and 1 catastrophic flood. A flood is classified as ‘major' if it is severe or catastrophic. Assuming the past 10 years are representative, calculate: a) the probability that a major flood occurs in any given year; b) the expected number of major floods over the next 5 years; c) if a new flood‑defence scheme reduces the probability of a major flood by 40 %, how many fewer major floods are expected over the next 5 years compared with the original scenario?
A. 0.7
Correct B. 0.6
C. 0.5
D. 0.4

Correct Answer: B

Want to see the full step-by-step solution? Unlock AI Explanation & Analytics
Question 8 View Details
Country X had a population of 12 million in the year 2000. From 2000 to 2010 the annual growth rate was a constant 2.5 %. From 2010 to 2020 the growth rate fell uniformly by 0.1 % each year, ending at 1.5 % in 2020. Estimate the population of Country X in 2020 (to one decimal place in millions).
A. 22.1
B. 20.3
Correct C. 18.8
D. 17.5

Correct Answer: C

Want to see the full step-by-step solution? Unlock AI Explanation & Analytics
Question 9 View Details
An agricultural field of 1 ha is ploughed to a depth of 15 cm. Two soils are under consideration. Soil A: bulk density = 1.3 g cm⁻³, gravimetric field capacity = 30 %, gravimetric wilting point = 15 %. Soil B: bulk density = 1.5 g cm⁻³, gravimetric field capacity = 28 %, gravimetric wilting point = 12 %. (a) Calculate the available water storage (in cubic metres) for each soil. (b) Which soil provides the greater water storage?
Correct A. Soil A: 292.5 m³; Soil B: 360 m³; Soil B provides greater storage
B. Soil A: 360 m³; Soil B: 292.5 m³; Soil A provides greater storage
C. Soil A: 280 m³; Soil B: 340 m³; Soil B provides greater storage
D. Soil A: 300 m³; Soil B: 350 m³; Soil B provides greater storage

Correct Answer: A

Want to see the full step-by-step solution? Unlock AI Explanation & Analytics
Question 10 View Details
Monthly average precipitation (mm) for Region Y is: Jan 80, Feb 70, Mar 90, Apr 120, May 150, Jun 200, Jul 250, Aug 240, Sep 180, Oct 130, Nov 90, Dec 80. Monthly mean temperatures (°C) are: Jan 22, Feb 23, Mar 24, Apr 26, May 28, Jun 30, Jul 31, Aug 31, Sep 29, Oct 27, Nov 24, Dec 22. Annual potential evapotranspiration is estimated at 1200 mm. a) Identify the Köppen climate classification of the region. b) Calculate the annual water surplus (precipitation minus evapotranspiration) in millimetres. c) A proposed irrigation scheme requires 200 mm of water per year. Based on the surplus, state whether the scheme is sustainable and, if so, the remaining surplus after meeting the irrigation demand.
A. Af; 360 mm; Sustainable, 160 mm remaining
B. Cfa; 480 mm; Sustainable, 280 mm remaining
Correct C. Af; 480 mm; Sustainable, 280 mm remaining
D. Af; 480 mm; Unsustainable, 0 mm remaining

Correct Answer: C

Want to see the full step-by-step solution? Unlock AI Explanation & Analytics
Question 11 View Details
A sedimentary rock sample contains 40% quartz, 30% calcite and the remaining 30% feldspar and mica by volume. During diagenesis, quartz grains increase by 25% in volume while calcite dissolves reducing its volume by 10%, the other minerals remaining unchanged. What is the new percentage of quartz in the rock (to two decimal places)?
A. 50.00%
B. 56.52%
Correct C. 46.73%
D. 45.45%

Correct Answer: C

Want to see the full step-by-step solution? Unlock AI Explanation & Analytics
Question 12 View Details
A farmer applies nitrogen fertilizer \(N\) (kg ha⁻¹). When annual rainfall is adequate (≥500 mm) the crop yield (ton ha⁻¹) follows \(Y = 2 + 0.05N\). In a dry year (350 mm) the yield falls to 80% of the amount given by the same formula. The probability of an adequate‑rainfall year is 0.6, independent each year. The farmer can afford at most 200 kg ha⁻¹ of nitrogen. Profit per hectare is revenue minus fertilizer cost, where revenue = £200 × expected yield and fertilizer cost = £0.5 × N. Determine the integer value of \(N\) (kg ha⁻¹) that maximises expected profit over a 5‑year period.
A. 150
B. 180
C. 190
Correct D. 200

Correct Answer: D

Want to see the full step-by-step solution? Unlock AI Explanation & Analytics
Question 13 View Details
A map has a scale of 1 cm : 5 km. The straight‑line distance between Town A and Town B on the map is 7.2 cm. What is the actual distance between the towns in kilometres?
A. 18 km
Correct B. 36 km
C. 3.6 km
D. 360 km

Correct Answer: B

Want to see the full step-by-step solution? Unlock AI Explanation & Analytics
Question 14 View Details
An industry's output is described by the Cobb‑Douglas function \(Q = 100 L^{0.6} K^{0.4}\), where \(L\) is the number of workers and \(K\) the number of machines. The firm currently employs 64 workers and 16 machines.\n(a) If labour is increased by 25 % while capital remains unchanged, what is the percentage increase in output?\n(b) If instead capital is increased by 50 % while labour stays at 64, which option gives the larger percentage increase in output?
A. Labour increase gives ≈16.0 % rise; capital increase gives ≈17.6 % rise - both increases are equal.
B. Labour increase gives ≈12.5 % rise; capital increase gives ≈15.0 % rise - capital increase is larger.
C. Labour increase gives ≈14.3 % rise; capital increase gives ≈13.0 % rise - labour increase is larger.
Correct D. Labour increase gives ≈14.3 % rise; capital increase gives ≈17.6 % rise - capital increase is larger.

Correct Answer: D

Want to see the full step-by-step solution? Unlock AI Explanation & Analytics
Question 15 View Details
In 2010 a town had a population of 120 000. The annual natural increase (births minus deaths) is 1.2 % of the population and net migration is -0.3 % per year. All 28 000 houses existing in 2010 were fully occupied. Each house can accommodate 4 persons.\n(a) How many additional houses must be built by the end of 2025 to house the projected population if each house holds 4 persons?\n(b) If the town wishes to keep the average occupancy at 3.5 persons per house by 2025, how many additional houses are required?
A. a) 7 100 additional houses; b) 12 000 additional houses
B. a) 5 800 additional houses; b) 10 500 additional houses
C. a) 6 900 additional houses; b) 10 800 additional houses
Correct D. a) 6 325 additional houses; b) 11 229 additional houses

Correct Answer: D

Want to see the full step-by-step solution? Unlock AI Explanation & Analytics
Question 16 View Details
A farmer can use two types of fertilizer, A and B. Each kilogram of A supplies \(30\) kg of nitrogen and costs \(\$2\). Each kilogram of B supplies \(20\) kg of nitrogen and costs \(\$1.5\). The farmer must supply at least \(300\) kg of nitrogen but not more than \(350\) kg, and the total amount of fertilizer applied cannot exceed \(12\) kg because of equipment limits. Assuming the farmer wants to meet the nitrogen requirement at minimum cost, determine how many kilograms of fertilizer A and of fertilizer B should be used (give answers to two decimal places).
A. A ≈ 9.50 kg, B = 3.50 kg
B. A ≈ 12.00 kg, B = 0.00 kg
Correct C. A ≈ 11.67 kg, B = 0.00 kg
D. A ≈ 10.00 kg, B = 2.00 kg

Correct Answer: C

Want to see the full step-by-step solution? Unlock AI Explanation & Analytics
Question 17 View Details
River section A drops \(150\) m in elevation over a horizontal distance of \(30\) km, while river section B drops \(80\) m over \(20\) km. The critical gradient for vertical erosion in this region is \(4\) m km\(^{-1}\). (i) Calculate the average gradient of each section (expressed in m km\(^{-1}\)). (ii) State which section is more likely to experience vertical erosion and justify your answer.
Correct A. Section A gradient = 5 m km⁻¹; Section B gradient = 4 m km⁻¹; Section A is more likely to experience vertical erosion.
B. Section A gradient = 3 m km⁻¹; Section B gradient = 2 m km⁻¹; Section A is more likely to experience vertical erosion.
C. Section A gradient = 4 m km⁻¹; Section B gradient = 5 m km⁻¹; Section B is more likely to experience vertical erosion.
D. Section A gradient = 5 m km⁻¹; Section B gradient = 4 m km⁻¹; Section B is more likely to experience vertical erosion.

Correct Answer: A

Want to see the full step-by-step solution? Unlock AI Explanation & Analytics
Question 18 View Details
Two alternative routes connect City X to City Y. *Route 1*: \(150\) km of highway travelled at an average speed of \(80\) km h\(^{-1}\), then a compulsory \(30\)-minute rest, followed by \(50\) km of mountain road travelled at \(40\) km h\(^{-1}\). *Route 2*: \(180\) km of expressway travelled at \(100\) km h\(^{-1}\) and then \(30\) km of urban road travelled at \(30\) km h\(^{-1}\); no rest is required. Calculate the total travel time for each route (in hours and minutes) and state which route is faster, giving the time advantage in minutes.
Correct A. Route 1 = 3 h 37.5 min; Route 2 = 2 h 48 min; Route 2 is faster by about 49.5 minutes.
B. Route 1 = 3 h 30 min; Route 2 = 2 h 40 min; Route 2 is faster by about 50 minutes.
C. Route 1 = 3 h 37.5 min; Route 2 = 2 h 48 min; Route 1 is faster by about 49.5 minutes.
D. Route 1 = 3 h 45 min; Route 2 = 2 h 55 min; Route 2 is faster by about 50 minutes.

Correct Answer: A

Want to see the full step-by-step solution? Unlock AI Explanation & Analytics
Question 19 View Details
In a geological outcrop three rock units are observed. - Unit A is a granite pluton. - Unit B is a metamorphic schist that cuts across Unit A. - Unit C is a limestone that overlies both units and contains fossils dated to \(150\) Ma. Field mapping shows that the schist intruded the granite \(10\) million years after the granite solidified, and that the limestone was deposited \(20\) million years after the schist intrusion. Determine the absolute age (in million years ago, Ma) of the granite pluton.
A. 190 Ma
B. 200 Ma
C. 170 Ma
Correct D. 180 Ma

Correct Answer: D

Want to see the full step-by-step solution? Unlock AI Explanation & Analytics
Question 20 View Details
The following table gives the average monthly rainfall (in mm) for a location: | Month | Rainfall (mm) | |-------|---------------| | Jan | 80 | | Feb | 70 | | Mar | 60 | | Apr | 50 | | May | 40 | | Jun | 30 | | Jul | 20 | | Aug | 20 | | Sep | 30 | | Oct | 50 | | Nov | 70 | | Dec | 80 | (i) Calculate the total rainfall for each calendar quarter (Q1 = Jan-Mar, Q2 = Apr-Jun, Q3 = Jul-Sep, Q4 = Oct-Dec) and identify the wettest and driest quarters. (ii) Compute the ratio of the wettest‑quarter total to the driest‑quarter total and state whether the location has a marked seasonal rainfall pattern (a ratio greater than 3 indicates a marked pattern).
A. Ratio = 2.5; rainfall pattern not markedly seasonal.
B. Ratio = 3.0; rainfall pattern markedly seasonal.
C. Ratio = 3.5; rainfall pattern markedly seasonal.
Correct D. Ratio = 3.0; rainfall pattern not markedly seasonal.

Correct Answer: D

Want to see the full step-by-step solution? Unlock AI Explanation & Analytics
Question 21 View Details
A location has the following average monthly temperatures (°C) and precipitation (mm):\nJan 5/80, Feb 6/70, Mar 9/60, Apr 12/55, May 16/50, Jun 20/45, Jul 22/40, Aug 21/45, Sep 18/55, Oct 13/70, Nov 8/80, Dec 5/85. Using the Köppen climate classification, determine the climate type of this location (e.g., Cfa, BSk).
Correct A. Cfa
B. Cfb
C. BSh
D. Dfa

Correct Answer: A

Want to see the full step-by-step solution? Unlock AI Explanation & Analytics
Question 22 View Details
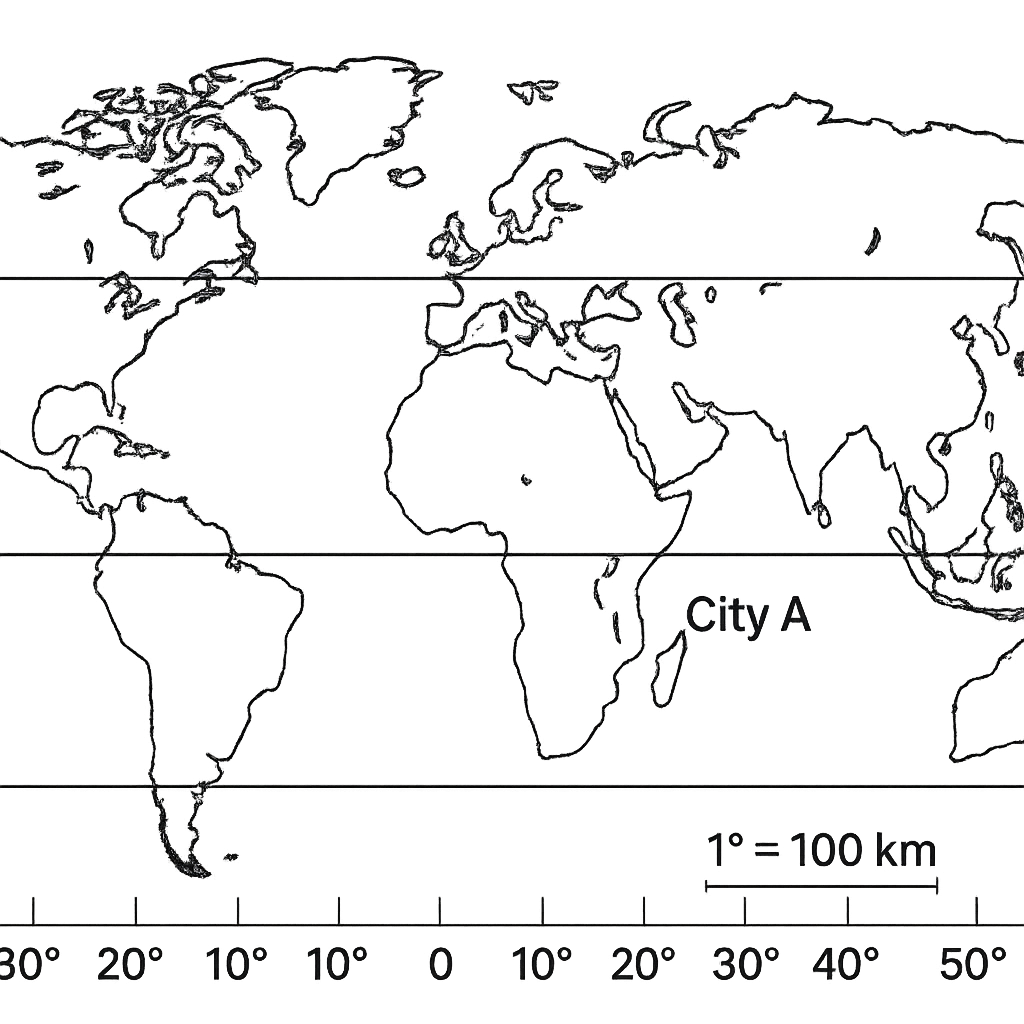
On the map, City A is marked at 12° N, 30° E and City B at 5° S, 45° E. Which city lies farther from the equator?
A. City D
Correct B. City A
C. City B
D. City C

Correct Answer: B

Want to see the full step-by-step solution? Unlock AI Explanation & Analytics
Question 23 View Details
Convert the coordinate 23° 34' 12'' N, 45° 12' 30'' E to decimal degrees.
A. 23.58° N, 45.208° E
B. 23.57° N, 45.208° W
C. 23.57° N, 45.12° E
Correct D. 23.57° N, 45.208° E

Correct Answer: D

Want to see the full step-by-step solution? Unlock AI Explanation & Analytics
Question 24 View Details
Basin X covers 120 km² and has a total stream length of 90 km. Basin Y covers 200 km² and has a total stream length of 80 km. Calculate the drainage density for each basin and state which basin is likely to generate greater surface runoff.
A. Basin Y
Correct B. Basin X
C. Both basins equally
D. Neither basin; insufficient data

Correct Answer: B

Want to see the full step-by-step solution? Unlock AI Explanation & Analytics
Question 25 View Details
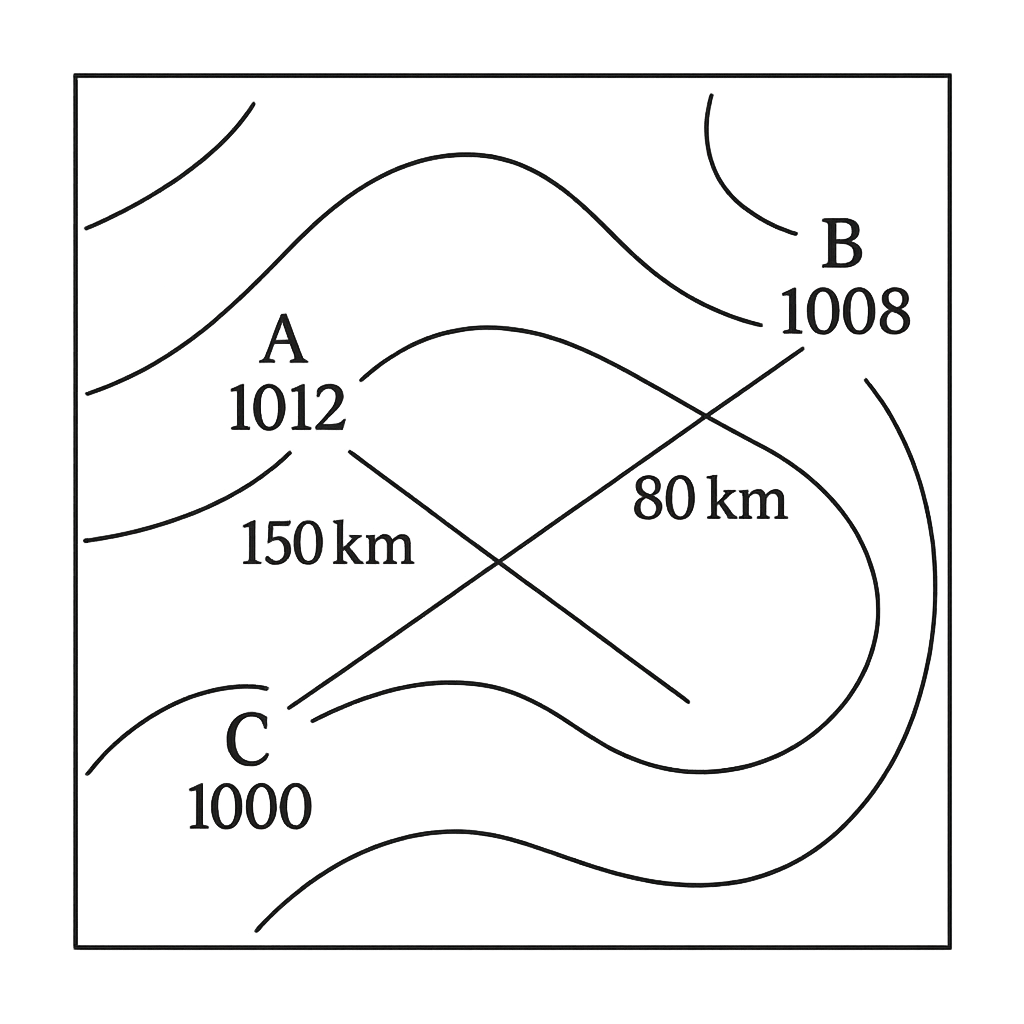
A simplified weather map shows three marked points: A (north‑west) with pressure 1012 hPa, B (north‑east) with pressure 1008 hPa, and C (south) with pressure 1000 hPa. The distances between the points are AB = 150 km, BC = 80 km, and AC = 200 km. Assuming wind speed is proportional to the pressure gradient and flows parallel to isobars, which point is expected to experience the highest wind speed?
Correct A. Point C
B. Point A and B
C. Point B
D. Point A

Correct Answer: A

Want to see the full step-by-step solution? Unlock AI Explanation & Analytics

Master the Exam!

You've seen a preview, but there are thousands more questions plus AI tutor to break down complex solutions.

Unlock Full Access Available for Android & Windows
Help others prepare! Share this practice hub:
Chat with Support