gce model questions vol1 2020 geography | Essay

Prepare for your exams with gce model questions vol1 questions? Reviewing past/model questions is one of the most effective ways to guarantee a high score. This practice hub features authentic 2020 geography (Essay) questions designed to simulate the real exam environment.

Practice these randomly selected questions to test your readiness.
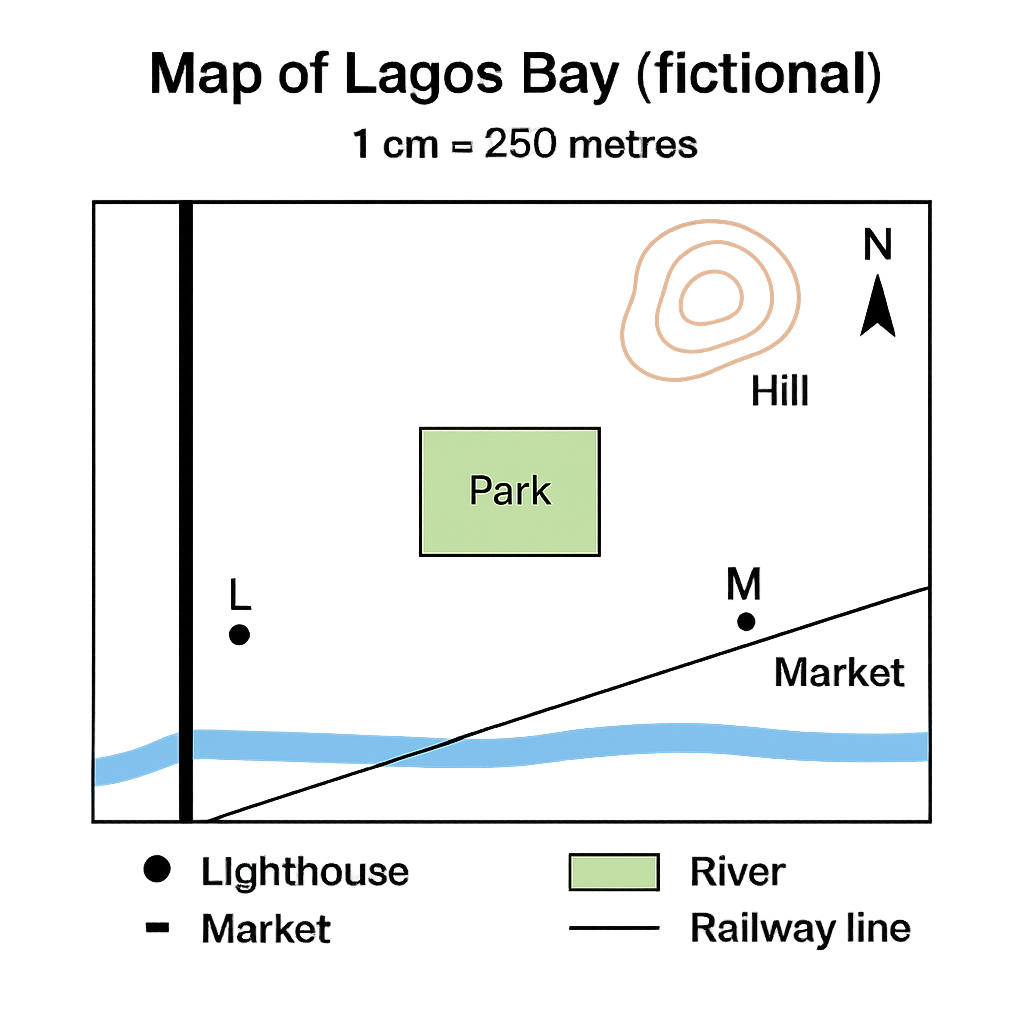
Question 1 View Details
The map shown is a plan of the fictional coastal town of Lagos Bay. The map uses a scale of 1 cm : 250 m. It includes a north arrow at the top, a river flowing east‑west across the lower part, a main road running north‑south on the western edge, a railway line running diagonally from south‑west to north‑east, a hill symbol at the north‑east corner, and two landmarks: the Lighthouse (point L) and the Market (point M). The straight‑line distance between L and M on the map measures 4.8 cm. The rectangular park shown on the map measures 3.2 cm (east‑west) by 2.5 cm (north‑south).
Question Parts
(a)
Determine the bearing of the line from the Lighthouse (L) to the Market (M).
(b)
Calculate the actual ground distance between L and M in kilometres.
(c)
Calculate the actual area of the rectangular park in hectares.
(d)
Discuss two advantages of using a larger‑scale map for urban planning in coastal towns.
Detailed Essay Solution & Marking Scheme Available

Get the step-by-step mathematical proofs, key points required by examiners, and a comprehensive breakdown from our AI Tutor.
Question 2 View Details
Two maps of the same region are provided. Map A has a scale of 1 cm : 500 m and Map B has a scale of 1 cm : 2 km. On Map A the measured distance between Town X and Town Y is 6.5 cm. On Map B the measured distance between the same towns is 3.2 cm.
Question Parts
(a)
Calculate the actual ground distance between Town X and Town Y in kilometres using the information from Map A.
(b)
Using the result from part (a), verify whether the measurement on Map B is consistent with its scale. Show your calculation and comment on any discrepancy.
(c)
If a new map of the region is to be produced with a scale that would represent the distance between X and Y as exactly 10 cm, determine the required scale (expressed as 1 cm : ___ m).
Detailed Essay Solution & Marking Scheme Available

Get the step-by-step mathematical proofs, key points required by examiners, and a comprehensive breakdown from our AI Tutor.

Question 3 View Details
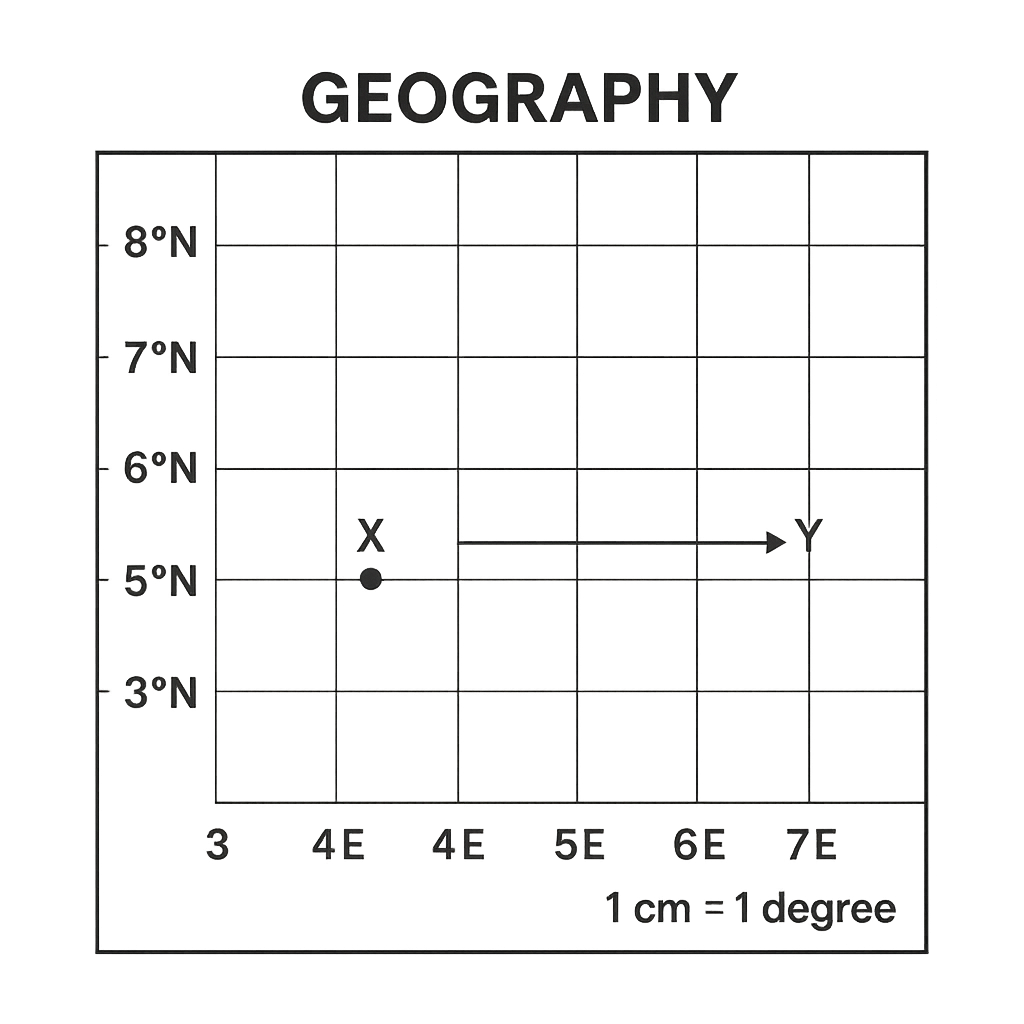
The map below shows a portion of a country with latitude lines drawn every 1° from 5°N to 8°N and longitude lines drawn every 1° from 3°E to 7°E. The map scale is 1 cm = 1°. City X is marked at the intersection of 6°N latitude and 4°E longitude. City Y is marked 3 cm directly east of City X on the map.
Question Parts
(a)
State the latitude and longitude of City Y.
(b)
Using the latitude‑longitude coordinates, estimate the straight‑line distance between City X and City Y. Assume 1° of latitude ≈ 111 km and 1° of longitude at 6°N ≈ 111 km × cos 6°.
Detailed Essay Solution & Marking Scheme Available

Get the step-by-step mathematical proofs, key points required by examiners, and a comprehensive breakdown from our AI Tutor.

Question 4 View Details
The table below gives observations taken at a weather station at 6‑hour intervals on a particular day. | Time (UTC) | Temperature (°C) | Pressure (hPa) | Wind direction | |------------|------------------|----------------|----------------| | 00:00 | 28 | 1012 | SSW | | 06:00 | 24 | 1008 | SW | | 12:00 | 20 | 1004 | W | | 18:00 | 22 | 1006 | NW | Answer the following questions:
Question Parts
(a)
Explain the formation of a cold front and the typical weather changes that accompany its passage.
(b)
Using the data in the table, identify the time at which the cold front most likely passed the station and justify your answer with reference to at least three observed changes.
Detailed Essay Solution & Marking Scheme Available

Get the step-by-step mathematical proofs, key points required by examiners, and a comprehensive breakdown from our AI Tutor.

Question 5 View Details
The table shows the average monthly temperature (°C) and rainfall (mm) recorded at Kano, Nigeria. Month | Temp (°C) | Rainfall (mm) --- | --- | --- January | 25 | 20 February | 27 | 15 March | 30 | 10 April | 33 | 5 May | 35 | 2 June | 34 | 1 July | 33 | 0 August | 32 | 0 September | 30 | 5 October | 28 | 10 November | 26 | 15 December | 25 | 20 Using this information, answer the following.
Question Parts
(a)
State the Köppen climate classification for Kano and justify your answer with reference to the data.
(b)
Identify two major atmospheric factors that contribute to Kano’s climate.
(c)
Calculate the annual mean temperature (to one decimal place) and the total annual rainfall.
(d)
Discuss how a projected increase of 2 °C in average temperature could affect wheat production in the region, taking the rainfall pattern into account.
Detailed Essay Solution & Marking Scheme Available

Get the step-by-step mathematical proofs, key points required by examiners, and a comprehensive breakdown from our AI Tutor.

Question 6 View Details
A field survey in the Jos Plateau recorded three distinct rock types with the following characteristics: 1. Coarse‑grained, light‑coloured rock composed mainly of quartz, feldspar and mica; visible crystals are interlocking. 2. Medium‑grained, reddish‑brown rock consisting of sand‑sized particles cemented together; contains occasional shell fragments. 3. Dark, fine‑grained rock that is dense and vesicular; it contains basaltic phenocrysts. Answer the questions that follow.
Question Parts
(a)
Identify each rock type (1, 2 and 3) and state its classification (igneous, sedimentary or metamorphic).
(b)
Explain how each of the three rocks could be transformed into another rock type through processes of the rock cycle.
(c)
Describe how the weathering of basalt contributes to soil fertility in a tropical savanna environment.
(d)
Evaluate the economic importance of granite in Nigeria’s construction industry, mentioning at least two factors that affect its utilisation.
Detailed Essay Solution & Marking Scheme Available

Get the step-by-step mathematical proofs, key points required by examiners, and a comprehensive breakdown from our AI Tutor.

Question 7 View Details
Landforms
Question Parts
(a)
Explain the formation of a cuesta, describing the role of differential erosion and the typical sequence of landforms that develop from the resistant caprock to the softer underlying strata.
(b)
Compare and contrast the landforms produced by karst processes with those produced by glacial erosion, focusing on their formation mechanisms, characteristic surface features and typical spatial distribution.
(c)
Discuss how rapid conversion of forested land to agriculture in a tropical river basin can modify rates of erosion and the resultant landforms, and suggest two mitigation measures that could be incorporated into land‑use planning.
Detailed Essay Solution & Marking Scheme Available

Get the step-by-step mathematical proofs, key points required by examiners, and a comprehensive breakdown from our AI Tutor.

Question 8 View Details
Drainage
Question Parts
(a)
Explain how the lithology of an area influences whether a dendritic or trellis drainage pattern develops, citing the key geological controls involved.
(b)
A region consists of alternating ridges of resistant sandstone (width 2 km) and valleys of softer shale (width 1 km) trending north‑south. Predict the dominant drainage pattern that would develop across this landscape and justify your prediction with reference to the geological setting.
(c)
A rapidly urbanising catchment within the same geological setting is experiencing frequent flash floods. Propose a comprehensive drainage management plan that reduces flood risk, incorporating both structural and non‑structural measures, and explain how each measure addresses the underlying causes of flooding.
Detailed Essay Solution & Marking Scheme Available

Get the step-by-step mathematical proofs, key points required by examiners, and a comprehensive breakdown from our AI Tutor.

Question 9 View Details
A farmer in a tropical savanna region intends to cultivate maize on a gently sloping field (gradient ≈ 5°). A soil profile taken from the field shows the following horizons: - O horizon: 5 cm thick, dark brown, high organic matter, no mineral particles. - A horizon: 20 cm thick, loamy texture, slightly acidic (pH ≈ 5.5), moderate organic matter, granular structure. - B horizon: 45 cm thick, red‑brown colour, high iron and aluminium oxides, clayey texture, hard when dry, pH ≈ 5.0. - C horizon: weathered basaltic rock fragments, little development. Using this information, answer the following: a) Identify the soil order (or specific soil type) that best fits the described profile. b) Discuss how each of the five factors of soil formation (climate, parent material, topography, organisms, time) has contributed to the development of this soil. c) Evaluate the suitability of this soil for maize production, considering texture, structure, depth, pH, nutrient status and drainage. d) Recommend two soil‑management practices that would improve the productivity of maize on this land, giving a brief justification for each.
Question Parts
(a)
Identify the soil order (or specific soil type) that best fits the described profile.
(b)
Discuss how each of the five factors of soil formation (climate, parent material, topography, organisms, time) has contributed to the development of this soil.
(c)
Evaluate the suitability of this soil for maize production, considering texture, structure, depth, pH, nutrient status and drainage.
(d)
Recommend two soil‑management practices that would improve the productivity of maize on this land, giving a brief justification for each.
Detailed Essay Solution & Marking Scheme Available

Get the step-by-step mathematical proofs, key points required by examiners, and a comprehensive breakdown from our AI Tutor.

Question 10 View Details
In a West African coastal region, a low‑lying tropical rainforest is being cleared for the establishment of an oil‑palm plantation. The original forest is characterised by multi‑layered canopy, high species richness, and a dense litter layer that contributes to rapid nutrient cycling. The conversion involves removal of the canopy, burning of the under‑storey, and replacement with uniformly spaced oil‑palm rows. Answer the following: a) Identify the original vegetation type and describe three of its key ecological characteristics. b) Analyse three major ecological impacts of converting this rainforest to oil‑palm on (i) biodiversity, (ii) climate regulation, and (iii) soil properties. c) Discuss two socio‑economic benefits that oil‑palm cultivation can bring to the local communities. d) Propose two sustainable land‑use strategies that could reconcile oil‑palm production with the conservation of forest functions, providing a brief justification for each.
Question Parts
(a)
Identify the original vegetation type and describe three of its key ecological characteristics.
Detailed Essay Solution & Marking Scheme Available

Get the step-by-step mathematical proofs, key points required by examiners, and a comprehensive breakdown from our AI Tutor.

Master the Exam!

You've seen a preview, but there are thousands more questions plus AI tutor to break down complex solutions.

Unlock Full Access Available for Android & Windows
Help others prepare! Share this practice hub:
Chat with Support