gce model questions vol1 2019 geography | Objective

Prepare for your exams with gce model questions vol1 questions? Reviewing past/model questions is one of the most effective ways to guarantee a high score. This practice hub features authentic 2019 geography (Objective) questions designed to simulate the real exam environment.

Practice these randomly selected questions to test your readiness.

Question 1 View Details
A map has a scale of \(1:50\,000\). The distance between Town A and Town B on the map measures \(3.2\) cm. What is the actual distance between the towns in kilometres?
A. 1.2
Correct B. 1.6
C. 3.2
D. 0.32

Correct Answer: B

Want to see the full step-by-step solution? Unlock AI Explanation & Analytics
Question 2 View Details
A circular drainage pipe runs full under a road. The pipe has an unknown internal diameter \(D\) (in metres). The pipe slope is \(S = 0.001\) (i.e., 0.1 %). The Manning roughness coefficient is \(n = 0.013\). The required discharge is \(Q = 0.12\) m³ s\(^{-1}\). Using Manning's equation, determine the minimum internal diameter \(D\) of the pipe, giving your answer to two decimal places (metres).
A. 0.45
B. 0.55
C. 0.60
Correct D. 0.50

Correct Answer: D

Want to see the full step-by-step solution? Unlock AI Explanation & Analytics
Question 3 View Details
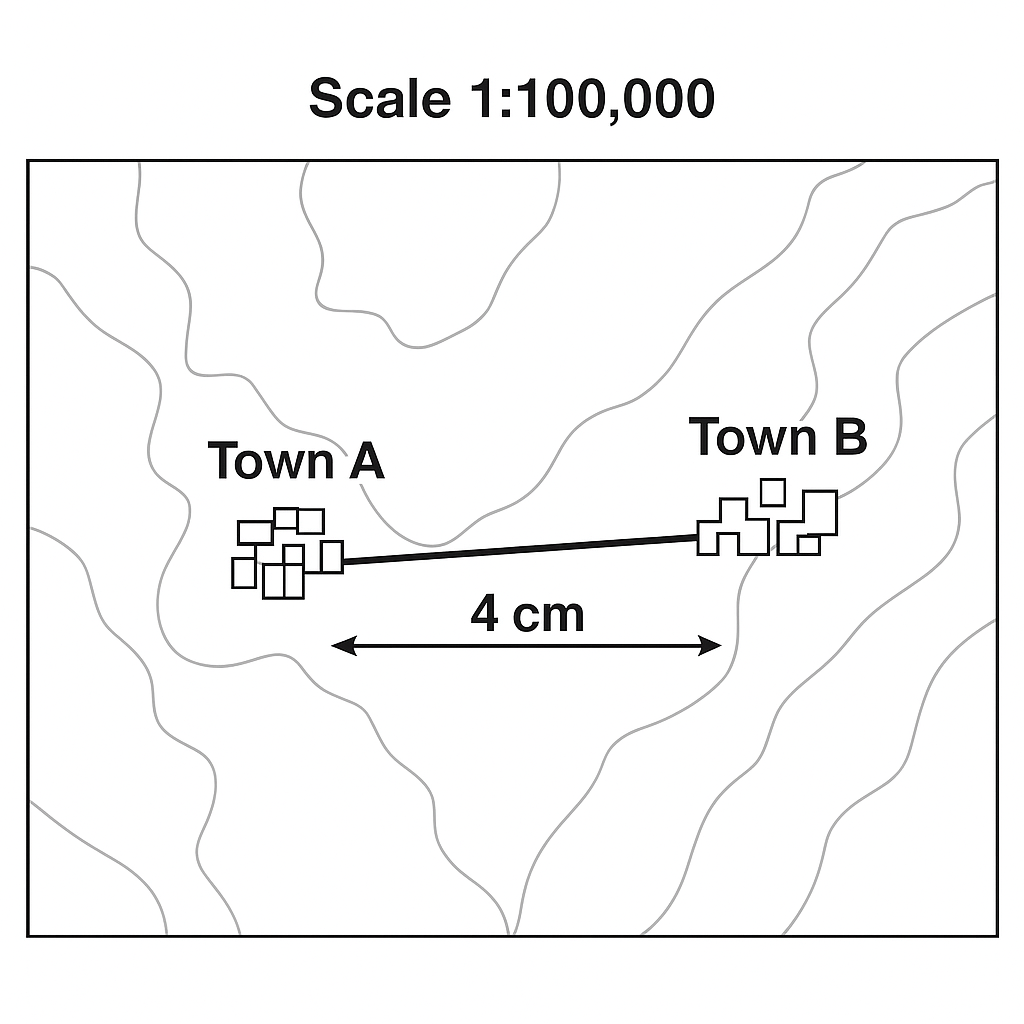
The map shown has a scale of \(1:100\,000\). The straight-line distance between towns A and B on the map measures \(4\) cm. What is the real-world distance between the towns in kilometres?
A. 8
B. 2
C. 0.4
Correct D. 4

Correct Answer: D

Want to see the full step-by-step solution? Unlock AI Explanation & Analytics
Question 4 View Details
The table below gives the main properties of three soils. Maize requires a soil pH between 6.0 and 6.5, an organic‑matter content of at least 2 %, and a moderate drainage characterised by an infiltration rate between 8 and 12 mm h\(^{-1}\). Which soil is the most suitable for maize cultivation? Provide the soil label (X, Y or Z).\n\n\begin{tabular}{lccc}\nSoil & pH & Organic matter (\%) & Infiltration (mm h\(^{-1}\))\\\n\hline\nX & 5.5 & 2 & 10\\\nY & 6.8 & 1 & 20\\\nZ & 6.2 & 3 & 5\\\n\end{tabular}
Correct A. Soil X
B. Soil W
C. Soil Z
D. Soil Y

Correct Answer: A

Want to see the full step-by-step solution? Unlock AI Explanation & Analytics
Question 5 View Details
On a map, each grid square represents \(5\) km. Two locations are \(3\) squares apart horizontally and \(4\) squares apart vertically. What is the straight-line distance between the two locations in kilometres?
A. 20
B. 30
C. 15
Correct D. 25

Correct Answer: D

Want to see the full step-by-step solution? Unlock AI Explanation & Analytics
Question 6 View Details
A rock sample contains \(40\%\) quartz, \(30\%\) feldspar, \(20\%\) mica and \(10\%\) amphibole by mass. A weathering process removes \(50\%\) of the feldspar and \(30\%\) of the mica, while quartz and amphibole remain unchanged. After weathering, what percentage of the remaining mass is quartz? Give your answer to one decimal place.
A. 40.0
B. 50.0
Correct C. 50.6
D. 51.3

Correct Answer: C

Want to see the full step-by-step solution? Unlock AI Explanation & Analytics
Question 7 View Details
Two towns are candidates for a new supermarket. The chain requires a minimum catch‑area population of 25 000. Town X is 12 km from the nearest existing supermarket and has a population of 18 000. Town Y is 20 km away and has a population of 30 000. The chain will locate the new supermarket in the town that maximises the ratio \(\frac{\text{population} - 25\,000}{\text{distance to existing supermarket}}\). Which town should be chosen?
A. Both towns
B. Town X
C. Neither town
Correct D. Town Y

Correct Answer: D

Want to see the full step-by-step solution? Unlock AI Explanation & Analytics
Question 8 View Details
A hill‑top town is situated at an altitude of 1500 m. The regional sea‑level mean annual temperature is \(26^{\circ}\text{C}\). Using the standard environmental lapse rate of \(6.5^{\circ}\text{C}\) per 1000 m, calculate the town's mean annual temperature (to one decimal place).
A. 15.0
B. 17.8
C. 18.5
Correct D. 16.3

Correct Answer: D

Want to see the full step-by-step solution? Unlock AI Explanation & Analytics
Question 9 View Details
A soil sample has a gravimetric field capacity of 0.25 g water g\(^{-1}\) soil and a gravimetric wilting point of 0.10 g g\(^{-1}\). Its bulk density is 1.5 g cm\(^{-3}\). Determine the plant‑available water (the difference between field capacity and wilting point) in millimetres per metre depth of soil.
A. 300
B. 180
Correct C. 225
D. 150

Correct Answer: C

Want to see the full step-by-step solution? Unlock AI Explanation & Analytics
Question 10 View Details
A farmer cultivates wheat on 10 ha. The base yield without nitrogen fertilizer is \(2.5\) t ha\(^{-1}\). Applying nitrogen increases yield by \(0.8\) t ha\(^{-1}\) for each 50 kg N ha\(^{-1}\) applied, but the response halves to \(0.4\) t ha\(^{-1}\) per 50 kg N ha\(^{-1}\) for any N applied beyond 150 kg ha\(^{-1}\). Nitrogen costs \(\₦30\) per kg. Wheat sells for \(\₦200\) per kg. Any nitrogen applied above 200 kg ha\(^{-1}\) can be sold as a by‑product at \(\₦10\) per kg. Environmental regulations limit the maximum nitrogen application to 300 kg ha\(^{-1}\). Determine the amount of nitrogen (kg ha\(^{-1}\)) that maximises profit and state the maximum profit per hectare (in \(\₦\)).
Correct A. 300 kg/ha, ₦1,212,000
B. 250 kg\/ha, ₦1,133,000
C. 150 kg\/ha, ₦975,500
D. 200 kg\/ha, ₦1,054,000

Correct Answer: A

Want to see the full step-by-step solution? Unlock AI Explanation & Analytics
Question 11 View Details
The following climate data are recorded for a location in the Northern Hemisphere: Average monthly temperatures (°C): Jan 5, Feb 6, Mar 8, Apr 12, May 16, Jun 20, Jul 22, Aug 21, Sep 18, Oct 13, Nov 9, Dec 6. Average monthly precipitation (mm): Jan 70, Feb 55, Mar 60, Apr 80, May 90, Jun 110, Jul 120, Aug 115, Sep 100, Oct 85, Nov 70, Dec 65. Using the Köppen climate classification system, determine the climate type (e.g., Cfb, BWh) for this location.
Correct A. Cfb
B. Dfb
C. Csb
D. Cfa

Correct Answer: A

Want to see the full step-by-step solution? Unlock AI Explanation & Analytics
Question 12 View Details
A city lies at latitude \(45^{\circ}\,\text{N}\). On the summer solstice the Sun's declination is \(+23.5^{\circ}\). What is the Sun's maximum altitude above the horizon at local noon on that day?
A. 66.5°
B. 71.5°
C. 63.0°
Correct D. 68.5°

Correct Answer: D

Want to see the full step-by-step solution? Unlock AI Explanation & Analytics
Question 13 View Details
Mean annual rainfall in a region is 800 mm and the mean annual temperature is 22 °C. The area experiences a distinct dry season lasting four consecutive months in which each month receives less than 50 mm of rain. Based on these data, which major vegetation type is most likely to dominate the area?
A. Temperate deciduous forest
B. Desert
C. Tropical rainforest
Correct D. Tropical savanna

Correct Answer: D

Want to see the full step-by-step solution? Unlock AI Explanation & Analytics
Question 14 View Details
A sandstone sample contains 92 % quartz, 5 % feldspar and 3 % lithic fragments (by volume). Using the Pettijohn sandstone classification, identify the type of sandstone.
A. Lithic arenite
Correct B. Quartz arenite
C. Graywacke
D. Feldspathic arenite

Correct Answer: B

Want to see the full step-by-step solution? Unlock AI Explanation & Analytics
Question 15 View Details
In a region that follows Christaller's Central Place Theory, a central place of order 3 provides high‑order services to surrounding settlements within a radius of 30 km, while an order 2 settlement provides medium‑order services within a radius of 10 km. A newly established settlement is located 25 km from the nearest order 3 centre. What order is the new settlement most likely to be, assuming it will provide services appropriate to its rank?
A. Order 3
Correct B. Order 2
C. Order 4
D. Order 1

Correct Answer: B

Want to see the full step-by-step solution? Unlock AI Explanation & Analytics
Question 16 View Details
The region experiences severe floods with an average frequency of \(0.2\) floods per year, each causing average damage of £\(3.5\) million. A mitigation project costing £\(4\) million upfront would reduce the flood frequency by \(30\%\). Assuming the frequency and damage remain constant over a 10‑year period, calculate the net economic benefit (in million pounds) of implementing the mitigation project. State the net benefit as a decimal (positive if the project saves money, negative if it costs more).
Correct A. -1.9
B. -0.5
C. 0.2
D. -3.2

Correct Answer: A

Want to see the full step-by-step solution? Unlock AI Explanation & Analytics
Question 17 View Details
The map scale is \(1\!:\!50{,}000\). The distance between Town X and Town Y measured on the map is \(3.2\) cm. What is the actual distance between the towns in kilometres? Give your answer to one decimal place.
Correct A. 1.6
B. 0.8
C. 2.0
D. 1.2

Correct Answer: A

Want to see the full step-by-step solution? Unlock AI Explanation & Analytics
Question 18 View Details
In a 10,000 km² region three vegetation types occur: tropical rainforest, savanna and desert. Rainfall depths are 2500 mm for rainforest, 1200 mm for savanna and 300 mm for desert. The total annual rainfall volume over the whole region is \(8\times10^{9}\) m³. If the area of savanna is \(0.8\) times the area of desert, determine the combined area (in km²) of savanna and desert. Round your answer to the nearest km².
Correct A. 9444
B. 9600
C. 9500
D. 9380

Correct Answer: A

Want to see the full step-by-step solution? Unlock AI Explanation & Analytics
Question 19 View Details
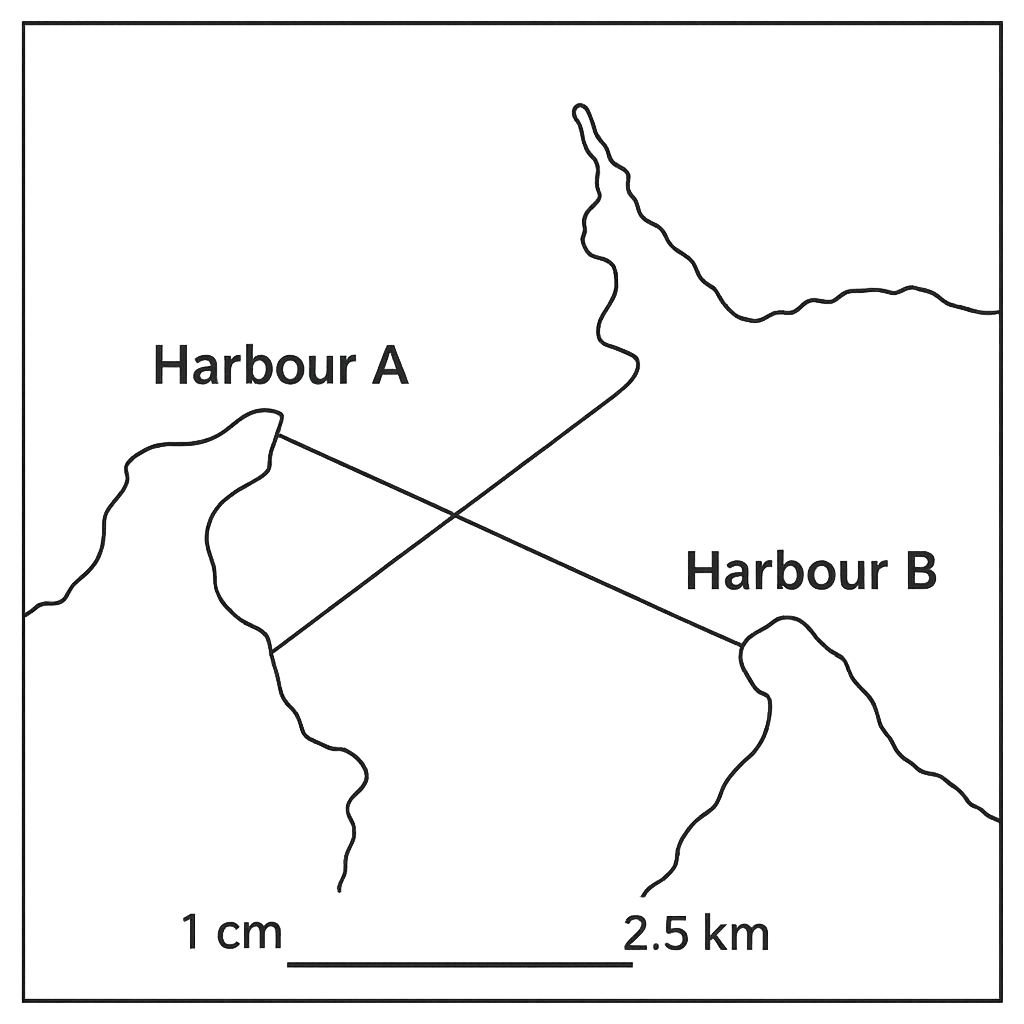
A map of a coastal region has a scale of \(1\!:\!250{,}000\). On the map the straight‑line distance between Harbour A and Harbour B measures \(5\) cm. What is the real distance between the two harbours in kilometres? Give your answer to one decimal place.
A. 15.0
B. 10.0
Correct C. 12.5
D. 13.0

Correct Answer: C

Want to see the full step-by-step solution? Unlock AI Explanation & Analytics
Question 20 View Details
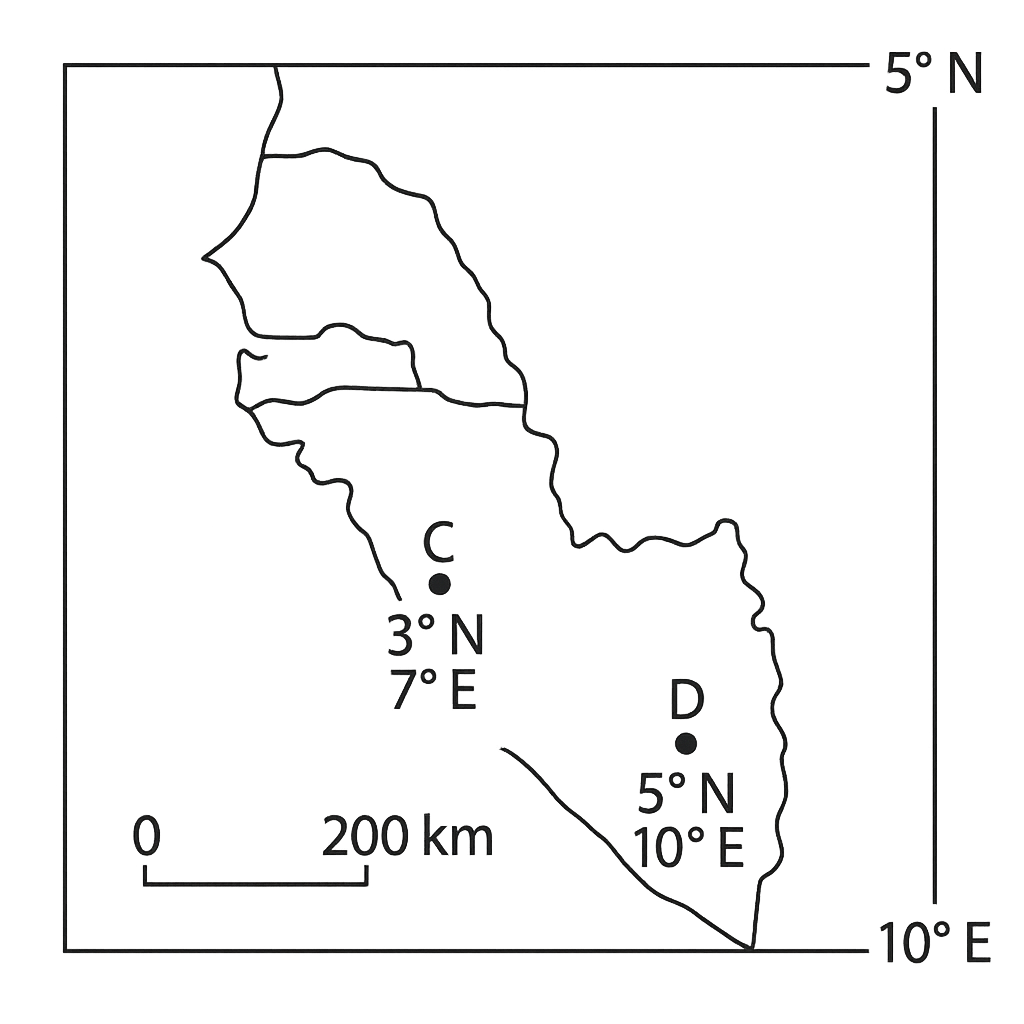
On a map the coordinates of City C are \(3^{\circ}\) N, \(7^{\circ}\) E and those of City D are \(5^{\circ}\) N, \(10^{\circ}\) E. Approximate the straight‑line distance between the two cities, assuming 1° of latitude equals 111 km and 1° of longitude equals 111 km × cos (average latitude). Give your answer to the nearest kilometre.
A. 450
B. 350
C. 500
Correct D. 400

Correct Answer: D

Want to see the full step-by-step solution? Unlock AI Explanation & Analytics
Question 21 View Details
At a weather station the sea‑level pressure was recorded at the following times: - 00:00 h: \(1012\) hPa - 03:00 h: \(1008\) hPa - 09:00 h: \(1008\) hPa - 12:00 h: \(1010\) hPa The pressure tendency index (PTI) for a 12‑hour period is defined as the sum of the absolute values of the pressure change in each successive 3‑hour segment, with a sign that reflects the overall change from the start to the end of the period (positive for a net rise, negative for a net fall). Calculate the PTI for the period and state whether it indicates a strengthening low pressure system, a strengthening high pressure system, or a neutral tendency.
Correct A. -6 hPa, indicating a strengthening low pressure system
B. +4 hPa, indicating a strengthening high pressure system
C. -2 hPa, indicating a neutral tendency
D. +6 hPa, indicating a strengthening high pressure system

Correct Answer: A

Want to see the full step-by-step solution? Unlock AI Explanation & Analytics
Question 22 View Details
The infiltration capacity of a soil follows Horton's equation \[\n f(t)=f_c+(f_0-f_c)\,e^{-k t},\n\] where \(f(t)\) is the infiltration capacity (mm h\(^{-1}\)) at time \(t\) (h), \(f_0\) is the initial capacity, \(f_c\) the steady‑state capacity and \(k\) the decay constant. For a particular site \(f_0=30\) mm h\(^{-1}\) and \(f_c=5\) mm h\(^{-1}\). After 2 h the measured capacity is \(12\) mm h\(^{-1}\). (a) Determine the decay constant \(k\) (to two decimal places). (b) Using this value of \(k\), calculate the cumulative infiltration \(I\) after 4 h, where \[\n I(t)=\int_{0}^{t} f(\tau)\,d\tau .\n\] Give \(I\) to one decimal place (mm).
A. k = 0.78 h⁻¹, cumulative infiltration I = 62.3 mm
Correct B. k = 0.64 h⁻¹, cumulative infiltration I = 56.2 mm
C. k = 0.64 h⁻¹, cumulative infiltration I = 50.0 mm
D. k = 0.45 h⁻¹, cumulative infiltration I = 48.7 mm

Correct Answer: B

Want to see the full step-by-step solution? Unlock AI Explanation & Analytics
Question 23 View Details
A factory produces a single product and sells each unit for £20. Variable production cost is £12 per unit, of which 40 % is labour cost. Fixed costs amount to £15 000 per month. (i) Calculate the break‑even output (in units) under the current cost structure. (ii) If the labour component of the variable cost rises by 10 % while all other costs remain unchanged, what is the new break‑even output? Round your answer to the nearest whole unit.
Correct A. Original break‑even: 1 875 units; New break‑even after labour increase: 1 995 units
B. Original break‑even: 1 800 units; New break‑even after labour increase: 2 050 units
C. Original break‑even: 1 700 units; New break‑even after labour increase: 1 850 units
D. Original break‑even: 1 950 units; New break‑even after labour increase: 2 100 units

Correct Answer: A

Want to see the full step-by-step solution? Unlock AI Explanation & Analytics
Question 24 View Details
Three environmental hazards are being assessed for a coastal community. The risk score for each hazard is calculated as \[\n R = P \times C \times w,\n\] where \(P\) is the annual probability of occurrence, \(C\) the consequence rating (on a scale of 1-10), and \(w\) a weighting factor reflecting vulnerability. The data are: | Hazard | \(P\) | \(C\) | \(w\) | |--------|------|------|------| | Flood | 0.02 | 8 | 1.2 | | Landslide | 0.01 | 9 | 1.0 | | Industrial accident | 0.005 | 10 | 1.5 | (a) Compute the risk score for each hazard and identify which has the highest risk. (b) If a mitigation programme reduces the flood probability by 50 %, recalculate the flood risk score and state the new highest‑risk hazard.
Correct A. Original scores - Flood: 0.192 (highest), Landslide: 0.090, Industrial: 0.075; After mitigation - Flood: 0.096 (still highest)
B. Original scores - Flood: 0.192 (highest), Landslide: 0.080, Industrial: 0.075; After mitigation - Flood: 0.096 (now Landslide highest)
C. Original scores - Flood: 0.180 (highest), Landslide: 0.090, Industrial: 0.075; After mitigation - Flood: 0.090 (still highest)
D. Original scores - Flood: 0.200 (highest), Landslide: 0.090, Industrial: 0.075; After mitigation - Flood: 0.100 (still highest)

Correct Answer: A

Want to see the full step-by-step solution? Unlock AI Explanation & Analytics
Question 25 View Details
A topographic map has a scale of 1 : 50 000. The distance between Town A and Town B measured on the map is 3.2 cm. What is the actual ground distance between the two towns in kilometres? Give your answer to one decimal place.
A. 2.0 km
B. 0.8 km
C. 3.2 km
Correct D. 1.6 km

Correct Answer: D

Want to see the full step-by-step solution? Unlock AI Explanation & Analytics

Master the Exam!

You've seen a preview, but there are thousands more questions plus AI tutor to break down complex solutions.

Unlock Full Access Available for Android & Windows
Help others prepare! Share this practice hub:
Chat with Support