gce model questions vol1 2017 geography | Essay

Prepare for your exams with gce model questions vol1 questions? Reviewing past/model questions is one of the most effective ways to guarantee a high score. This practice hub features authentic 2017 geography (Essay) questions designed to simulate the real exam environment.

Practice these randomly selected questions to test your readiness.
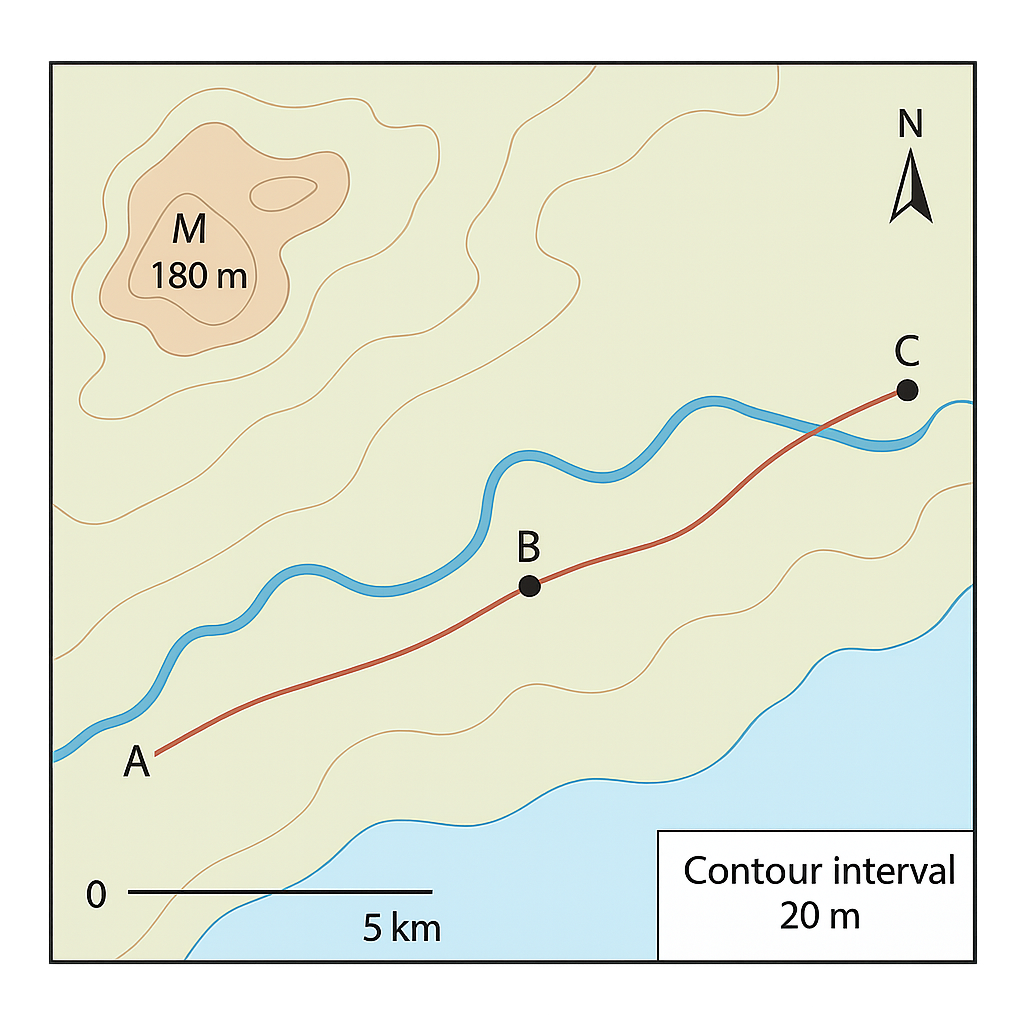
Question 1 View Details
The map below shows a coastal region. It includes three towns (A, B and C), a river that flows roughly east‑west, a main road linking the towns, a mountain range in the north‑west, a scale bar where 1 cm represents 5 km, a north arrow and contour lines drawn at 20 m intervals. The summit of the mountain is marked at 180 m above sea level.
Question Parts
(a)
State the bearing of the line joining Town A to Town C, measured clockwise from north.
(b)
The distance on the map from Town B to the nearest point on the river measures 3.2 cm with a ruler. Calculate the actual ground distance in kilometres.
(c)
If the summit of the mountain is marked at 180 m, determine the elevation of a point that lies two contour lines lower.
(d)
Discuss two advantages and two limitations of using a map of this scale (1 cm : 5 km) for planning a new road that will link Town A and Town C.
Detailed Essay Solution & Marking Scheme Available

Get the step-by-step mathematical proofs, key points required by examiners, and a comprehensive breakdown from our AI Tutor.
Question 2 View Details
The map below depicts a river basin. It shows Town D, Town E, a railway line that follows the river, and a shaded area that represents the floodplain. The map scale is 1 cm : 10 km. The legend states that the shaded floodplain occupies 6.5 cm² on the map. An inset at the bottom‑right corner of the map shows the whole basin at a reduced scale of 1 : 1,000,000.
Question Parts
(a)
Calculate the actual area (in km²) represented by the shaded floodplain.
(b)
The length of the river between points F and G measures 7.5 cm on the map. Determine the actual river length in kilometres.
(c)
Explain why a reduced scale (1 : 1,000,000) is used for the inset and discuss one advantage and one disadvantage of using such a reduced scale for regional planning.
Detailed Essay Solution & Marking Scheme Available

Get the step-by-step mathematical proofs, key points required by examiners, and a comprehensive breakdown from our AI Tutor.

Question 3 View Details
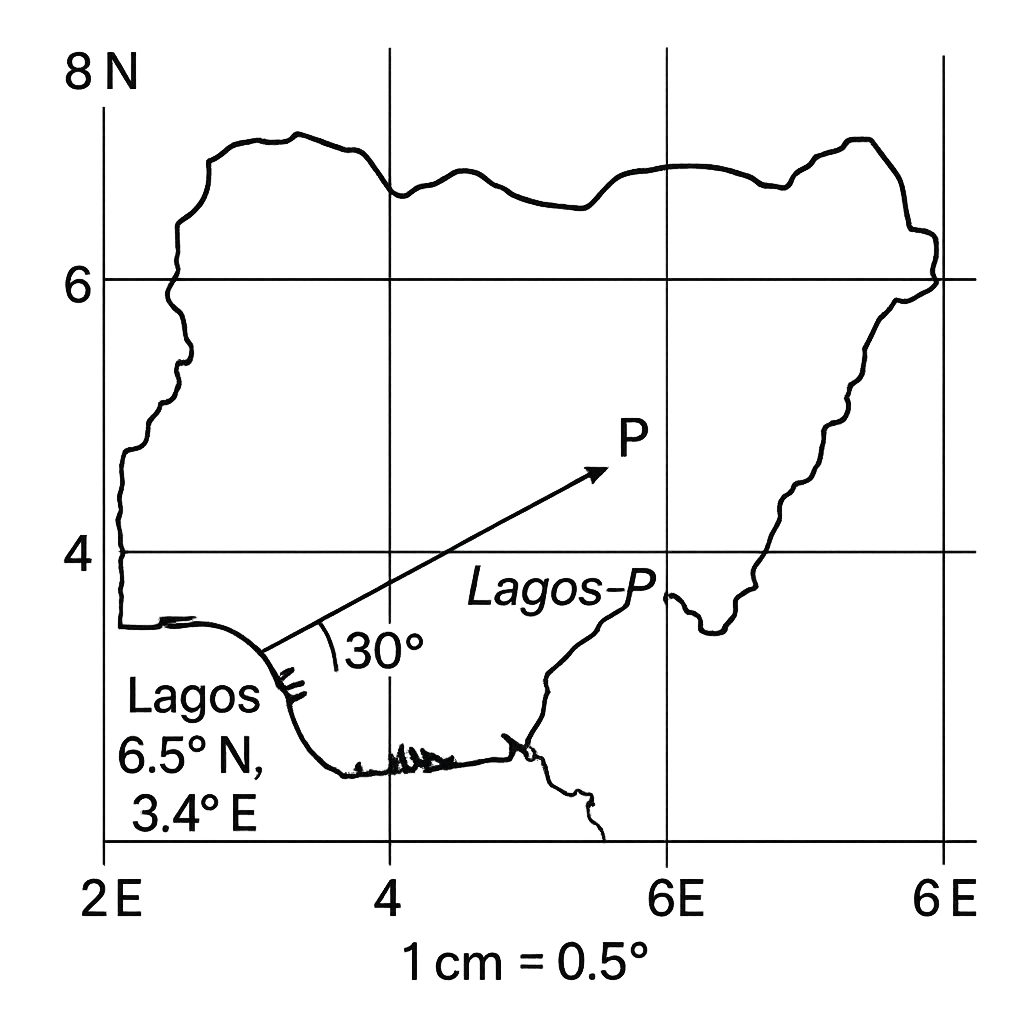
Refer to the map of Nigeria provided in the diagram. The map uses a scale of 1 cm = 0.5° of latitude or longitude. The city of Lagos is shown at its approximate position and is labelled with its coordinates (6.5° N, 3.4° E). A location P is marked on the map. The straight line joining Lagos to P measures 4.0 cm on the map and makes an angle of 30° north of east (measured anticlockwise from the east direction).
Question Parts
(a)
Calculate the latitude and longitude of point P to one decimal place.
(b)
Explain how the scale on the map allows conversion between map distance and angular distance, and discuss one limitation of using such a scale for representing large geographic areas.
Detailed Essay Solution & Marking Scheme Available

Get the step-by-step mathematical proofs, key points required by examiners, and a comprehensive breakdown from our AI Tutor.

Question 4 View Details
Discuss the main factors that influence the seasonal weather patterns in Nigeria and evaluate how these factors affect agricultural activities in the northern and southern regions.
Question Parts
(a)
Identify and describe the two dominant wind systems that affect Nigeria’s climate, indicating the months during which each is most active.
(b)
Explain how the Inter‑tropical Convergence Zone (ITCZ) movement contributes to the distribution of the rainy and dry seasons across Nigeria.
Detailed Essay Solution & Marking Scheme Available

Get the step-by-step mathematical proofs, key points required by examiners, and a comprehensive breakdown from our AI Tutor.

Question 5 View Details
The table below shows the mean monthly temperature (°C) and total monthly rainfall (mm) recorded at the coastal city of Lagos over a typical year. | Month | Mean Temp (°C) | Rainfall (mm) | |-------|----------------|---------------| | Jan | 27.0 | 30 | | Feb | 28.0 | 45 | | Mar | 28.5 | 70 | | Apr | 28.0 | 120 | | May | 27.5 | 200 | | Jun | 26.5 | 250 | | Jul | 26.0 | 300 | | Aug | 26.0 | 280 | | Sep | 26.5 | 210 | | Oct | 27.0 | 120 | | Nov | 27.0 | 60 | | Dec | 27.0 | 35 | Using this information, answer the following:
Question Parts
(a)
Classify the climate of Lagos according to the Köppen climate classification system. State the appropriate code and justify your choice using the data provided.
(b)
Explain the seasonal pattern of temperature and rainfall observed in the table, linking it to Lagos’s geographical position and prevailing wind systems.
(c)
Discuss two likely impacts of projected climate change on agricultural practices in the Lagos region.
Detailed Essay Solution & Marking Scheme Available

Get the step-by-step mathematical proofs, key points required by examiners, and a comprehensive breakdown from our AI Tutor.

Question 6 View Details
Three rock samples have been collected from different locations on the Jos Plateau. Their physical characteristics are described below. Sample I: Dark‑coloured, fine‑grained, exhibits conchoidal fracture, feels greasy, and has a hardness of 7 on the Mohs scale. Sample II: Light‑coloured, coarse‑grained, shows visible interlocking crystals, has a gritty feel, and a hardness of 6.5. Sample III: Medium‑coloured, contains visible fragments of quartz and feldspar set in a fine matrix, is porous, and has a hardness of 3. Answer the following questions:
Question Parts
(a)
Identify the type of each rock (Sample I, II, III) and explain the reasoning based on the described properties.
(b)
For each identified rock, describe the geological processes that led to its formation on the Jos Plateau.
(c)
Considering their physical properties, recommend which rock would be most suitable for use as a road‑base material and justify your choice.
Detailed Essay Solution & Marking Scheme Available

Get the step-by-step mathematical proofs, key points required by examiners, and a comprehensive breakdown from our AI Tutor.

Question 7 View Details
The map of Country X shows a variety of physical features including a coastal plain, a plateau, and a mountain range.
Question Parts
(a)
Identify two processes that have contributed to the formation of the coastal plain and explain how each process operates.
(b)
The plateau has an average elevation of 1500 m and a gently undulating surface. Discuss two factors that influence the climate of the plateau and how they affect temperature and precipitation.
(c)
The mountain range consists of folded mountains with a highest peak of 2500 m. Using the concept of orographic rainfall, explain why the windward side receives higher rainfall than the leeward side, and discuss one possible impact of this rainfall pattern on human settlement.
Detailed Essay Solution & Marking Scheme Available

Get the step-by-step mathematical proofs, key points required by examiners, and a comprehensive breakdown from our AI Tutor.

Question 8 View Details
River Y drains a mixed‑lithology catchment of 12 000 km². The river is 180 km long, has a mean annual discharge of 45 m³ s⁻¹ and a gradient that changes from 0.02 in the upper course (60 km) to 0.001 in the lower course (120 km). The catchment consists of 60 % resistant igneous rocks and 40 % easily erodible sedimentary rocks.
Question Parts
(a)
Calculate the average gradient of the river over its entire length and discuss how the variation in gradient influences the river’s energy and sediment‑transport capacity.
(b)
Using the concept of river regime, classify the likely regime of River Y and justify your classification with reference to the data provided.
(c)
The region is considering constructing a dam in the middle course. Evaluate three potential positive and three potential negative impacts of the dam on the river’s hydrology, sediment load and downstream ecosystems.
Detailed Essay Solution & Marking Scheme Available

Get the step-by-step mathematical proofs, key points required by examiners, and a comprehensive breakdown from our AI Tutor.

Question 9 View Details
A farmer in the northern part of Nigeria is planning to expand his farm and wants to understand the soil characteristics of the area. The following soil profile was obtained from a field investigation: Depth (cm) | Colour | Texture | Structure | pH | Organic Matter (%) | Observed Limitation --- | --- | --- | --- | --- | --- | --- 0‑20 | Dark brown | Loam | Granular | 6.2 | 2.5 | Low nitrogen 20‑50 | Light brown | Sandy loam | Blocky | 5.8 | 1.2 | Low water‑holding capacity 50‑80 | Reddish‑brown | Sandy | Platy | 5.3 | 0.8 | Susceptible to erosion 80‑120 | Light brown | Sandy | Massive | 5.0 | 0.5 | Low fertility
Question Parts
(a)
Describe the main pedogenic processes that have produced each horizon in the profile, linking the observed properties to the dominant process.
(b)
Classify the soil to the most appropriate FAO soil group and justify your classification using the data provided.
(c)
Recommend three soil management practices that would improve the productivity of the soil for maize cultivation, explaining the principle behind each practice.
(d)
Discuss the likely consequences of continued soil erosion on the long‑term sustainability of agriculture in this region.
Detailed Essay Solution & Marking Scheme Available

Get the step-by-step mathematical proofs, key points required by examiners, and a comprehensive breakdown from our AI Tutor.

Question 10 View Details
The following description summarises the main vegetation types found across three contrasting Nigerian ecological zones: Zone A – Sahelian savanna: Annual rainfall 400‑600 mm, mean temperature 28‑34 °C. Dominant vegetation consists of scattered drought‑tolerant trees (e.g., Acacia spp.) and an understory of short, perennial grasses. Zone B – Guinea forest: Annual rainfall 1 500‑2 000 mm, mean temperature 22‑28 °C. The area is characterised by dense, multi‑stratal evergreen forest with a rich understory of shade‑tolerant shrubs and ferns. Zone C – Mangrove swamp (coastal): Annual rainfall 2 200‑2 500 mm, mean temperature 24‑30 °C. Vegetation is dominated by mangrove species (Rhizophora spp., Avicennia spp.) forming a dense fringe along tidal waterways, with a soft, water‑logged substrate. Using the information above, answer the following:
Question Parts
(a)
Identify the vegetation type that would be classified as a tropical rainforest and justify your choice with reference to the climatic and floristic information provided.
(b)
Explain how the leaf morphology of the dominant trees in the Sahelian savanna reflects adaptation to the prevailing environmental conditions.
(c)
Compare the soil fertility challenges faced by agriculture in the Guinea forest zone and the Mangrove swamp zone, and suggest one mitigation strategy for each.
Detailed Essay Solution & Marking Scheme Available

Get the step-by-step mathematical proofs, key points required by examiners, and a comprehensive breakdown from our AI Tutor.

Master the Exam!

You've seen a preview, but there are thousands more questions plus AI tutor to break down complex solutions.

Unlock Full Access Available for Android & Windows
Help others prepare! Share this practice hub:
Chat with Support