Utme 2017 Mathematics Question 31
Practice objective / multiple choice question 31 from the 2017 Utme Mathematics examination. This question covers Statistics, Charts .
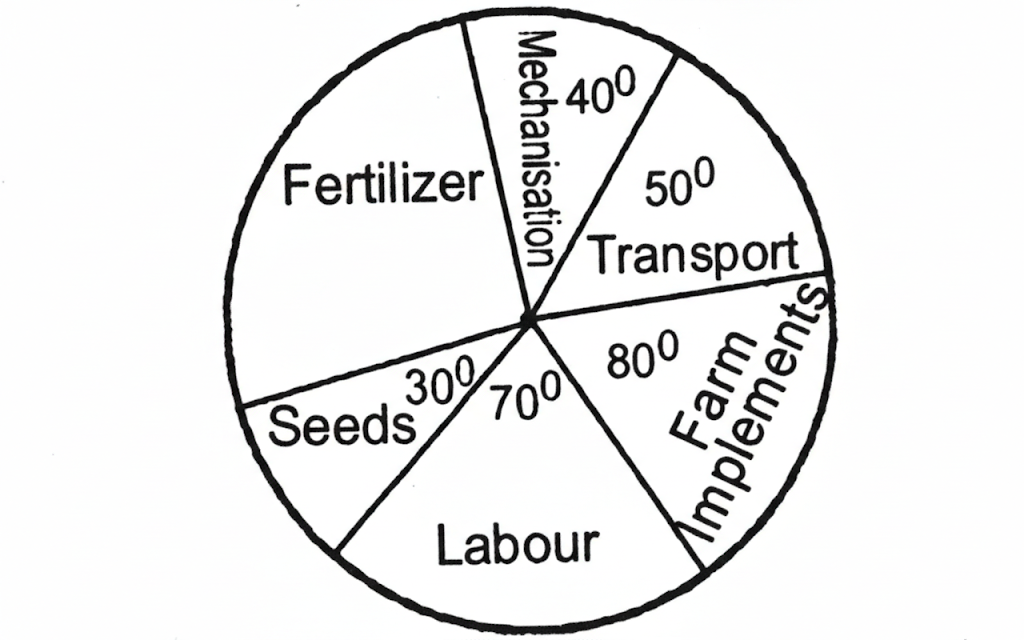
The pie chart above shows all allocation of money to each sector in a farm. The total amount allocated to the farm is N 80.00.
Answer Options
About This Question
This is Utme 2017 Mathematics Question 31. It is one of the objective questions from the 2017 Utme Mathematics examination.
The question covers Statistics, Charts .
Difficulty level: 3 .
Master the Exam!
You've seen a preview, but there are thousands more questions plus AI tutor to break down complex solutions.